Figure 3. Th1-induced T-bethi BDN cells are pre-ASCs.
(a–h) Transcriptome analysis of in vitro generated IgDnegCD27neg BDN cells from Be1 and Be2 co-cultures. RNA-seq analysis performed on IgDnegCD27neg BDN cells (gating in panel a) that were sort-purified from day 6 HD Be1 and Be2 co-cultures. Heat map (b), showing 427 differentially expressed genes (DEGs) based on FDR < 0.05. T-bet mRNA expression levels (c) in BDN cells from day 6 Be1 and Be2 co-cultures. Gene Set Enrichment Analysis (GSEA, panels d-h) comparing transcriptome profile of in vitro generated BDN cells from Be1 and Be2 co-cultures with published DEGs identified in different B cell subsets. Data are reported as Enrichment Score (ES) plotted against the ranked BDN Be1 and Be2 gene list (n = 11598). DEG lists used for GSEA include: DEGs that are upregulated in sort-purified SLE patient-derived T-bethi DN2 cells (CD19hiIgDnegCD27negCXCR5negIgG+) compared to other SLE patient-derived mature B cell subsets (d, Jenks et al., 2018); DEGs that are upregulated in human plasma cells (ASCs) relative to: BN cells (e, Abbas et al., 2005), total B cells (f, Tarte et al., 2003) or switched memory (BSW) B cells (g, Abbas et al., 2005); and IRF4-dependent upregulated target genes in ASCs (h, Shaffer et al., 2008). (i–j) IgDnegCD27neg T-bethi BDN cells express intermediate levels of IRF4. Gating strategy (i) to identify CD38hiCD27+ ASCs, IgD+CD27neg B cells and IgDnegCD27neg BDN cells in day 6 Be1 co-cultures generated from HD BN cells. Expression of T-bet and IRF4 (j) by ASCs (blue), IgD+CD27neg B cells (green) and IgDnegCD27neg BDN cells (red) from day 6 Be1 co-cultures. (k–l) BDN Be1 cells rapidly differentiate into ASCs. BDN cells from day 6 HD Be1 and Be2 cultures were sort-purified, Cell-Trace Violet (CTV) labeled and incubated 18 hr in conditioned medium. Enumeration of ASCs (CD19loCD38hiCD27+) in the undivided cells (D0, ) and the cells that divided one time (D1, ). Representative flow plots (k) showing the frequency of cells in D0 or D1 in each culture and the frequency of CD19loCD38hiCD27+ ASCs present in the D0 or D1 fraction. Panel (l) reports frequency of ASCs within the cultures from 3 independent experiments. See Supplementary file 1 for BDN Be1 and Be2 RNA-seq data set and Supplementary file 2 for SLE patient-derived T-bethi BDN DEG list. See Figure 3—figure supplement 1 for proliferation profile of the T-bethiIRF4int BDN subset in Be1 cells. RNA-seq performed with 3 samples/subset derived from 3 independent paired co-culture experiments. Statistical analysis performed with unpaired (c) or paired (l) Students t test. Nominal P values (d–h) for GSEA are shown. P values *<0.05, **<0.01.
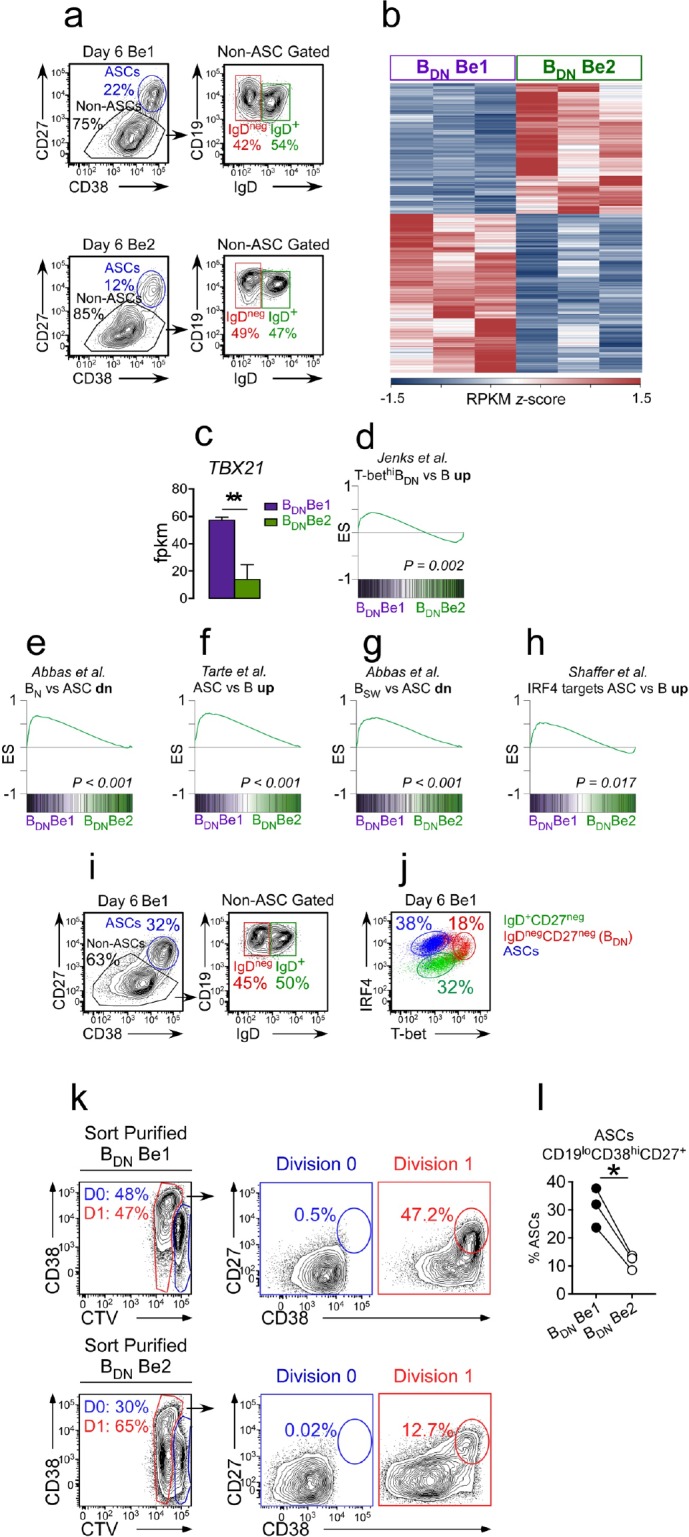
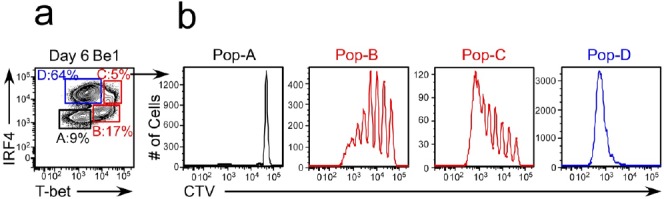
Figure 3—figure supplement 1. Comparison of the proliferative profile of T-bethiIRF4int pre-ASCs and T-betloIRF4hi ASCs.