Figure 6. IFNγ cooperates with R848, IL-2 and IL-21 to promote development and recovery of ASCs.
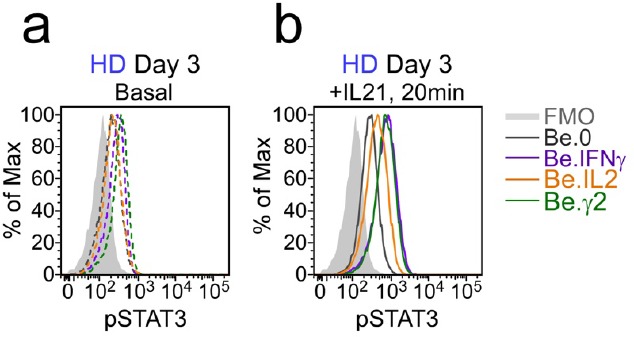
(a–d) IFNγ synergizes with subthreshold amounts of TLR7/8 ligand to induce proliferation and differentiation of BN cells. CTV-labeled HD BN cells were activated for 3 days (Step 1) with anti-Ig, IL-2, and increasing concentrations of R848 (as indicated) in the presence or absence of IFNγ (10 ng/ml). Cells were washed and re-cultured for 3 additional days (Step 2) with IL-21 and the same concentration of R848 that was used in Step 1. B cell division was measured on day 6 in cultures that were activated with IFNγ (green circles) or without IFNγ (orange circles) in the presence of no R848 (0 μg/ml, (a), high dose R848 (10 μg/ml, (b) or low dose R848 (0.1 μg/ml, (c). The frequency of CD38hiCD27+ ASCs (d) on day 6 is shown. (e–i) IFNγ cooperates with IL-2 to promote ASC development and recovery. Cartoon (e) depicting CTV-labeled HD BN cells activated for 3 days (Step 1) with anti-Ig and R848 alone (Be.0); with anti-Ig +R848+IFNγ (Be.IFNγ); with anti-Ig +R848+IL-2 (Be.IL2); or with anti-Ig +R848+IFNγ+IL-2 (Be.γ2). Cells were then washed and recultured for an additional 3 days (Step 2) with R848 and IL-21. The percentage of cells that have undergone cell division (f), the total cell recovery (g), the ASC frequencies (h) and total ASCs recovered (i) from each day 6 culture are shown. (j–k) Early IFNγ signals regulate IL-21R signaling. Phospho-STAT3 (pSTAT3) expression levels (reported as Mean Fluorescence Intensity (MFI)) in day 3 HD Be.0, Be.IFNγ, Be.IL2 and Be.γ2 cells under basal conditions (j) or following 20 min IL-21 stimulation (k). See Figure 6—figure supplement 1 for measurements of ASC formation in cultures containing cross-titrated IFNγ and R848. See Figure 6—figure supplement 2 for representative flow cytometry plots from Be.0, Be.IFNγ, Be.IL2 and Be.γ2 cells showing CD38hiCD27+ ASCs and CTV dilution on day 6. See Figure 6—figure supplement 3 for representative flow cytometry plots showing pSTAT3 expression. Data are representative of ≥3 experiments and are shown as the mean ±SD of cultures containing purified BN cells from 2 to 3 independent healthy donors. All statistical analyses were performed using one-way ANOVA with Tukey’s multiple comparison test. P values *<0.05, **<0.01, ***<0.001, ****<0.0001.

Figure 6—figure supplement 1. IFNγ signals promote B cell differentiation in response to subthreshold concentrations of R848.
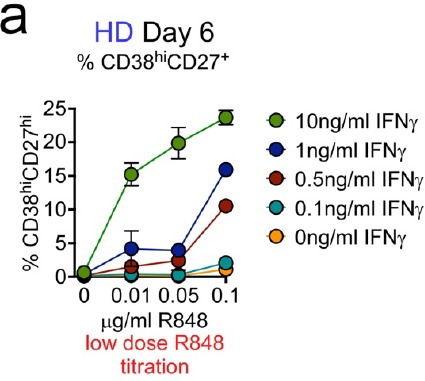
Figure 6—figure supplement 2. Flow cytometric characterization of B cells activated during the early priming phase in the presence or absence of IFNγ and IL-2.
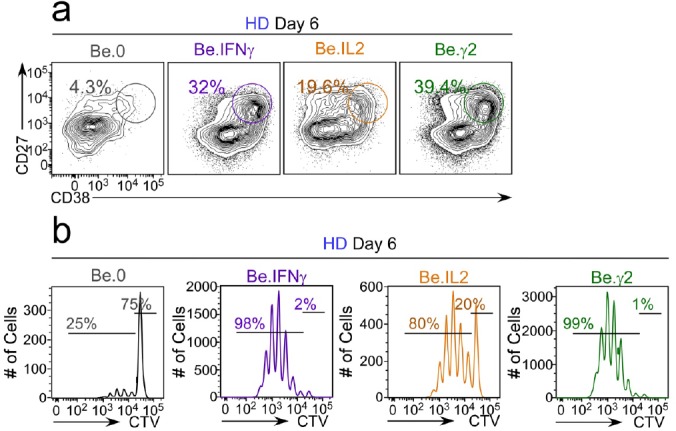
Figure 6—figure supplement 3. Flow cytometric analysis of phospho-STAT3 levels in day 3 Be.0, Be.IFNγ, Be.IL2 and Be.γ2 cells.