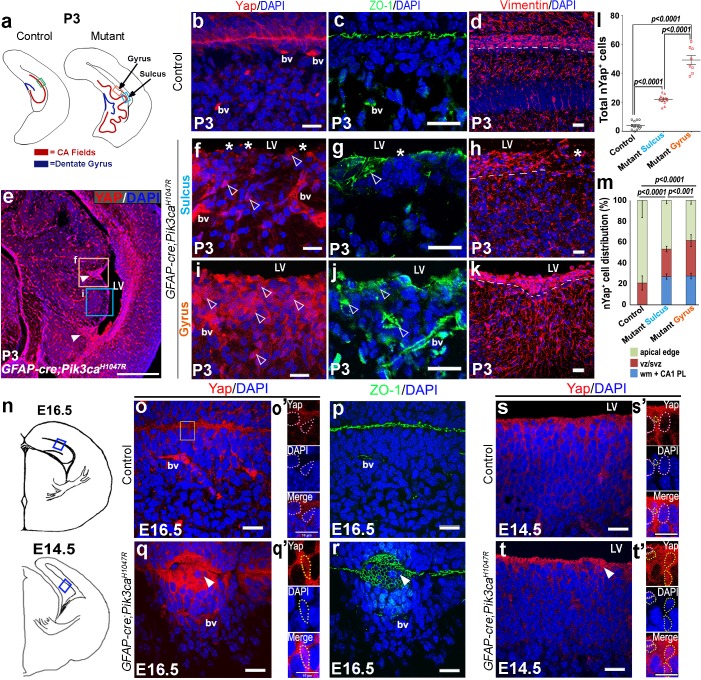
Figure 5. Embryonic induction of Pik3caH1047R mutation disrupts early developing ependyma and induces increase in nYap+ cells.
(a,n) Schematics of P3, E16.5 and E14.5 hemi-sections; boxed regions depict areas of interest. (b-d,o,o’p,s,s’) Ependymal markers Yap and Vimentin, and junction protein ZO-1 are localized at the apical lining of P3, E16.5 and E14.5 control CA1 respectively. Additionally, Yap and ZO-1 mark the blood vessel membranes (bv), while Vimentin mark the hippocampal radial glia. (e) P0 mutant CA1 gyral ventricular lining showed presence of focal nYap-enriched zones (arrowheads, orange box), interspersed by Yap-sparse zones at the sulci (cyan box). (f,i) Increased Yap+ nuclei in P3 mutant gyri (open arrowheads) and Yap-sparse mutant sulcus edge (asterisks) indicated disrupted ependyma. (g,j) ZO-1 was ectopically expressed in P3 mutant gyral ventricular zone, with breaks in the sulcus areas. (h,k) Vimentin+ fibers appeared to be arranged in an hour-clock pattern at the gyri; sulci demonstrated more disoriented fibers and gaps (asterisk); dashed lines mark the basal ependymal edge. (l,m) Total number and distribution of nYap+ cells in the different CA1 subzones (binned as mono-layer apical edge, ventricular-subventricular zone (vz/svz), white matter (wm) and CA1 pyramidal layer (CA1 PL)) were significantly enhanced in P3 mutant, compared to control littermates (total counts: F = 179.1, df = 28; cell distribution: F = 137.8, df = 86). The control CA1 showed minimal existence of nYap+ cells beyond the vz/svz. Data are represented as mean ± SEM in scatter plots (l) or 100% stacked columns (m); one-way and two-way ANOVA were performed respectively. (o–q’) Compared with control, E16.5 Pik3caH1047R mutant showed abnormal zippering of forebrain apical membranes, combined with focal nYap expression (arrowheads). (s–t’) Compared with control, E14.5 mutant medial apical membrane showed subtle disruption of cell adhesion causing minor buckling/unevenness. Magnified images of E14.5 and E16.5 ventricular edge demonstrated higher number of nYap+ cells in the mutant (yellow dotted lines) compared to controls (o’,q’,s’,t’); some non-nYap+ cells are marked with pink dotted lines for the purpose of comparison (o’,s’,t’). Scale bars: 20 μm (b–d, f–k, o–t), 500 μm (e), 10 μm (o’,q’,s’,t’). See also Figure 5—figure supplement 1.


