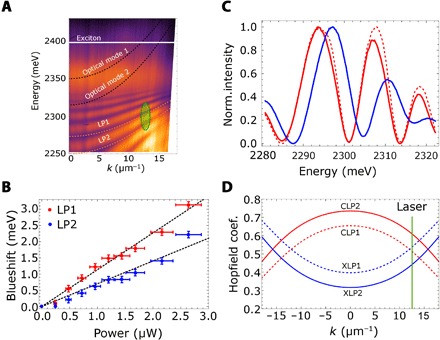
Fig. 4. Nonlinearities in a 2D perovskite single crystal.

(A) Reflectivity spectra obtained for a PEAI single-crystal slab; the same excitonic mode is coupled to several optical modes of the slab; the two lower polariton modes highlighted by orange dashed lines originate from the coupling of the two optical modes (black dashed lines) to the excitonic mode (white solid line). (B) Energy shift of the lower polariton modes of (A) as a function of the incident power; the energy shift is measured at k ∼ 12.7 corresponding to the green region of (A). (C) Reversibility of the observed blueshift of the polariton modes; the red continuous curve corresponds to the energy of the polariton modes for low excitation power P = 10 ; the continuous blue curve shows the blueshifted modes at high excitation power P = 150 ; when the excitation power is reduced, the polariton modes recover the original energy (dashed red curve). (D) Hopfield coefficients showing the exciton (XLP1, XLP2) and photon (CLP1, CLP2) fraction of the two lower polariton modes of (A); the green vertical line represents the in-plane momentum of the resonantly created polariton, where LP1 has a larger exciton fraction than LP2.
