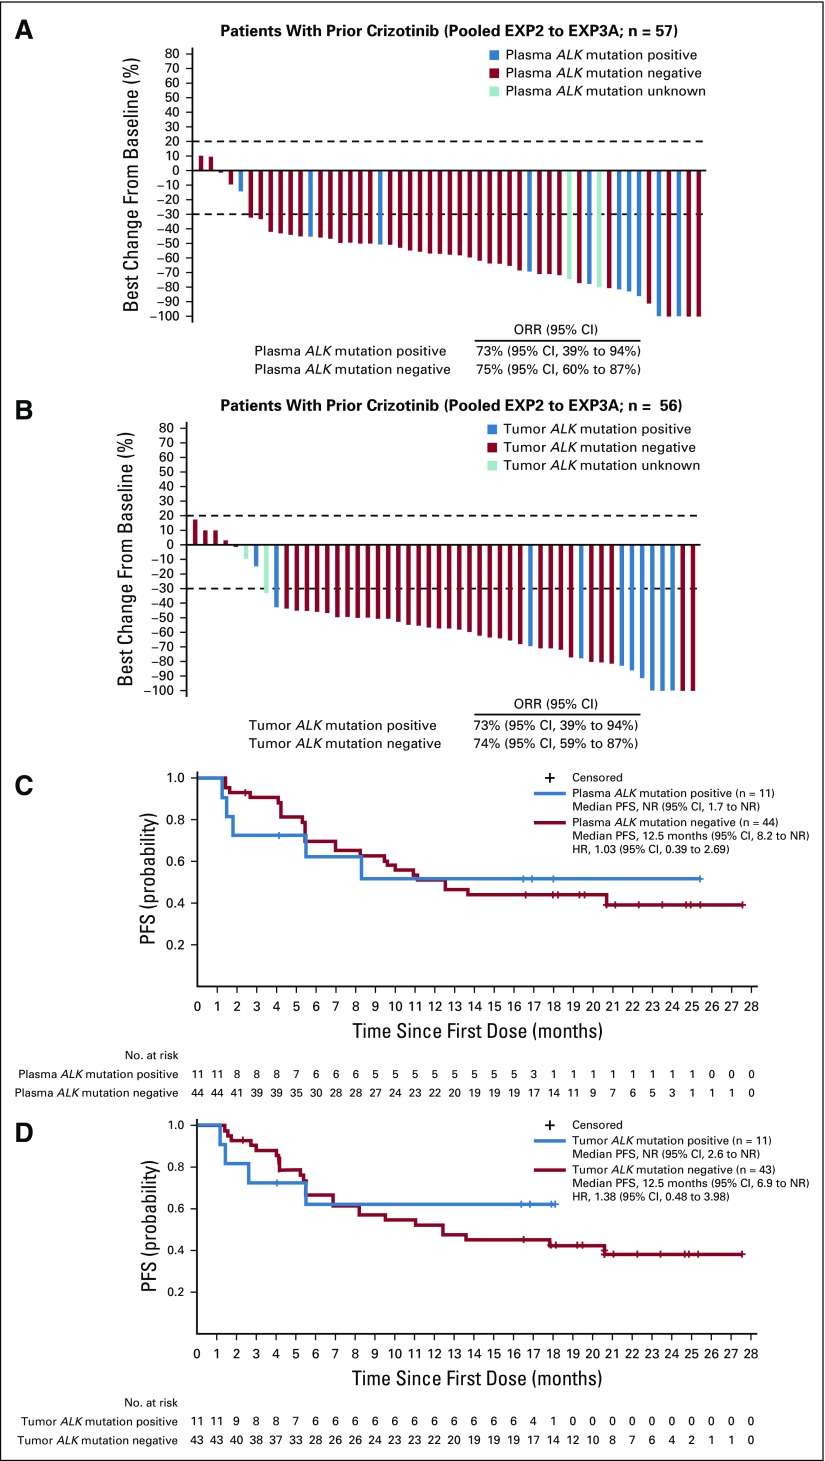
FIG 3.
Efficacy of lorlatinib in crizotinib-resistant patients (expansion cohorts EXP2 to EXP3A), according to anaplastic lymphoma kinase (ALK) mutation status. Shown are waterfall plots summarizing the best percentage change in target lesions, with ALK mutation status determined by (A) plasma genotyping or (B) tissue genotyping. Blue bars indicate patients with one or more ALK mutations, red bars indicate patients without detectable ALK mutations, and aqua bars indicate two samples that failed analysis. Two patients in EXP2 to EXP3A did not have plasma samples for cell-free DNA analysis. Patients with at least one on-study target lesion assessment were included. If any assessment procedures differed from or were not interchangeable with the procedure at screening, the change from baseline could not be calculated and is not displayed. Kaplan-Meier curves of progression-free survival (PFS) are also shown according to ALK mutation status, as determined by (C) plasma genotyping or (D) tissue genotyping. Vertical lines on the curves indicate censoring of data. HR, hazard ratio; NR, not reached; ORR, objective response rate.

