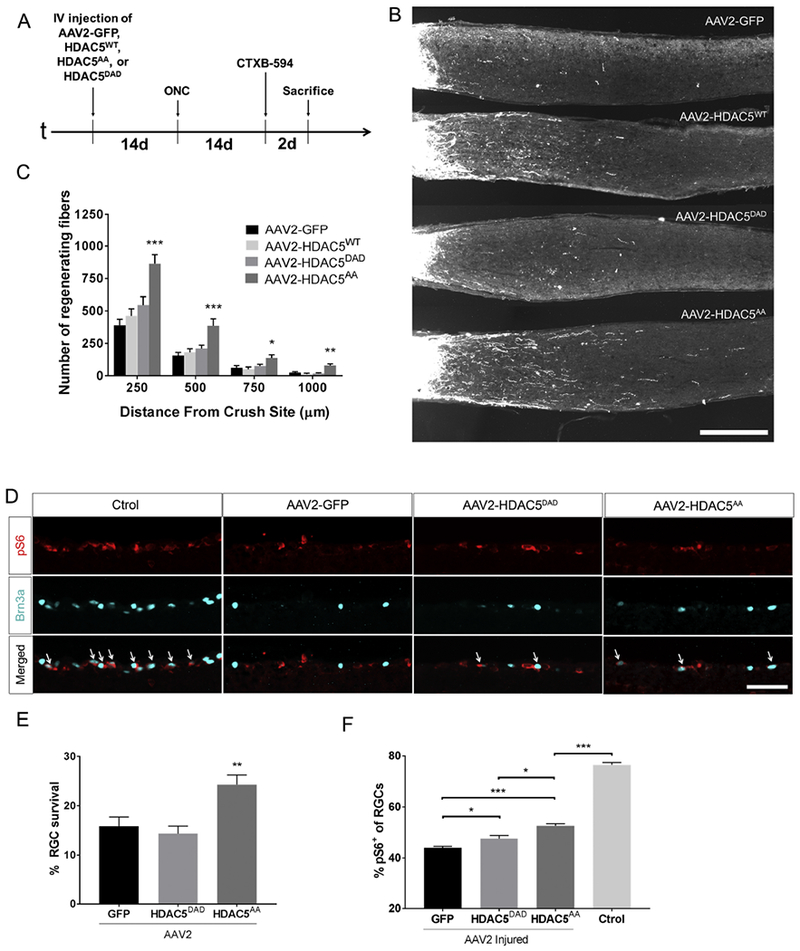
Figure 3. Overexpression of HDAC5AA but not GFP, HDAC5WT, or HDAC5DAD promotes optic nerve regeneration and RGC survival.

(A) Timeline showing experimental procedures, including intravitreal injection of AAV2-GFP, AAV2-FLAG-HDAC5WT, AAV2-FLAG-HDAC5AA, or AAV2-FLAG-HDAC5DAD, optic nerve crush (ONC), intravitreal injection of Alexa 594 fluorescently labeled cholera toxin b (CTXB-594), and sacrifice of mice. (B) Representative optic nerve sections showing that there are more regenerating axons in retinas infected with AAV2-FLAG-HDAC5AA than in the other conditions. (C) Quantification of (B) showing significant differences in optic nerve transducted with AAV2-FLAG-HDAC5AA compared to other conditions at all distances analyzed. Plotted values in (C) were quantified and expressed as mean ± SEM. One-way ANOVA with Bonferroni post hoc analysis, * p<0.05, ** p<0.01, *** p<0.001. Scale bar = 250 μm. N=20 for AAV2-GFP, n=4 for AAV2-FLAG-HDAC5WT, n=9 for AAV2-FLAG-HDAC5DAD and n=14 for AAV2-FLAG-HDAC5AA. (D) Retinal sections from mice that were injected with AAV2-GFP, AAV2-FLAG-HDAC5AA, or AAV2-FLAG-HDAC5DAD 15 days prior optic nerve injury and sacrificed 15 days post injury, were stained with Brn3a (nucleus, green, a marker for RGCs) and pS6 (cytoplasm, red, a marker of mTOR activation). The non-injured non-injected contralateral retina was included as Control. Arrows indicate colocalization of both markers. (E) Quantification of the percentage of Brn3a positive cells in injured retinas compared to the non-injured contralateral retina. (F) Quantification of the percentage of pS6+/Brn3a+ cells. Plotted values in (B) and (C) were quantified and expressed as mean ± SEM. Statistical Analysis was One-way ANOVA with Tukey’s post hoc test. B and D, Scale bar = 500 μm. N=5
