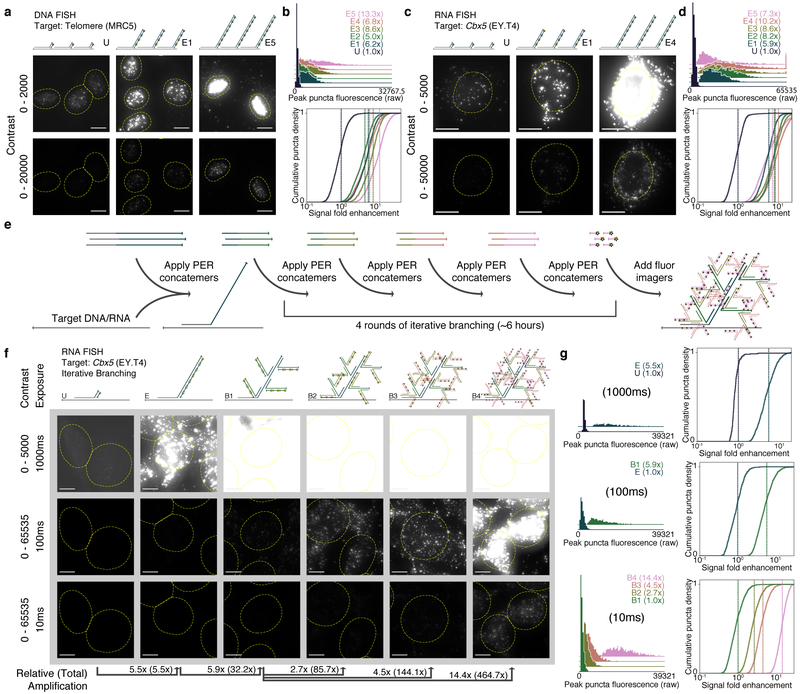
Figure 2: SABER effectively amplifies fluorescent signals.
a, Microscopy images for unextended (U) and two different lengths of PER-concatemerized probes (E1, E5) targeting the human telomere sequence. See Supplementary Fig. 2b for images of E2, E3, and E4. b, Distributions of peak fluorescence intensity values for CellProfiler38- detected puncta (top, fold enhancements in legend). Normalized background-subtracted cumulative distribution functions showing fold enhancement over the unextended condition (U), with vertical lines depicting means (fold enhancement, bottom). See Supplementary Fig. 2d for additional analyses. n(puncta): n(U)=1,895; n(E1)=1,846; n(E2)=1,876; n(E3)=2,011; n(E4)=2,190; n(E5)=2,006. c, Images for unextended (U) and two extension lengths (E1, E4) of a 122 probe pool targeting the mouse Cbx5 mRNA transcript. See Supplementary Fig. 2f for additional images. d, Distributions analogous to part (B) from CellProfiler38-identified puncta within cell bodies. Mean lines shown on distributions. See Supplementary Fig. 2g for additional analyses. n(puncta): n(U)=1,720; n(E1)=1,588; n(E2)=1,649; n(E3)=2,099; n(E4)=2,884; n(E5)=3,279. e, Schematic showing how multiple rounds of PER concatemer binding (branching) can be used to further increase signal. f, Representative images for samples with unextended probes (U), extended (E), and up to four rounds of branching (B1 through B4) are shown. g, Relative fluorescence was compared as previously but with no background subtraction to estimate amplification fold enhancement. In total, amplification fold enhancement over unextended probes was estimated to be 465×. Mean lines shown on distributions. See Supplementary Fig. 3e for additional analyses. n(puncta, exposure time): n(U, 1000ms)=262; n(E, 1000ms)=928; n(E, 100ms)=717; n(B1, 100ms)=1,821; n(B1, 10ms)=1,818; n(B2, 10ms)=1,796; n(B3, 10ms)=2,059; n(B4, 10ms)=1,344. Scale bars: 10 μM.

