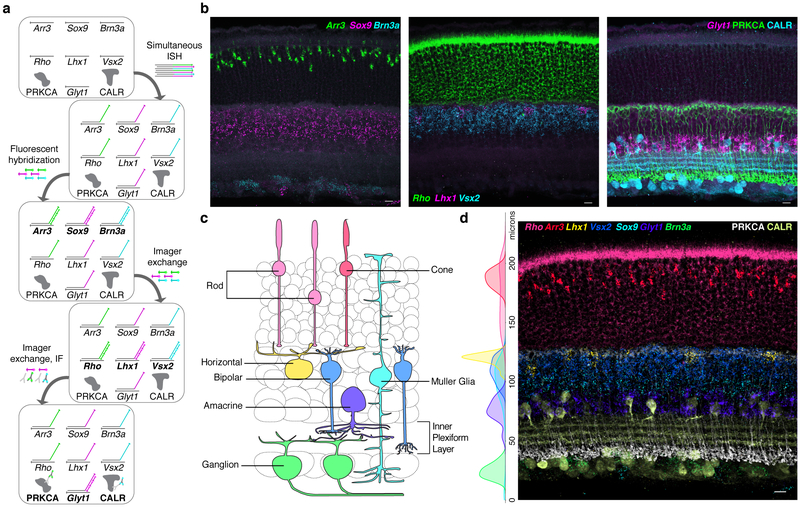
Figure 5: Exchange-SABER for detection of cell types in retina tissue.
a, Workflow for serial FISH detection of 7 transcripts and IF detection of two protein targets. b, Three FISH detection cycles for identification of 7 retinal cell populations. IF was performed after the 3rd FISH detection. c, Schematic representation of the retinal cell classes detected. d, All nine channels overlaid following puncta thresholding, with additional tissue autofluorescence background subtracted by a Gaussian filter masking channels around detected puncta. Side plot: Marker positive segmented cells plotted by distance from the inner limiting membrane. n(cells)=649. Scale bars: 10 μm.

