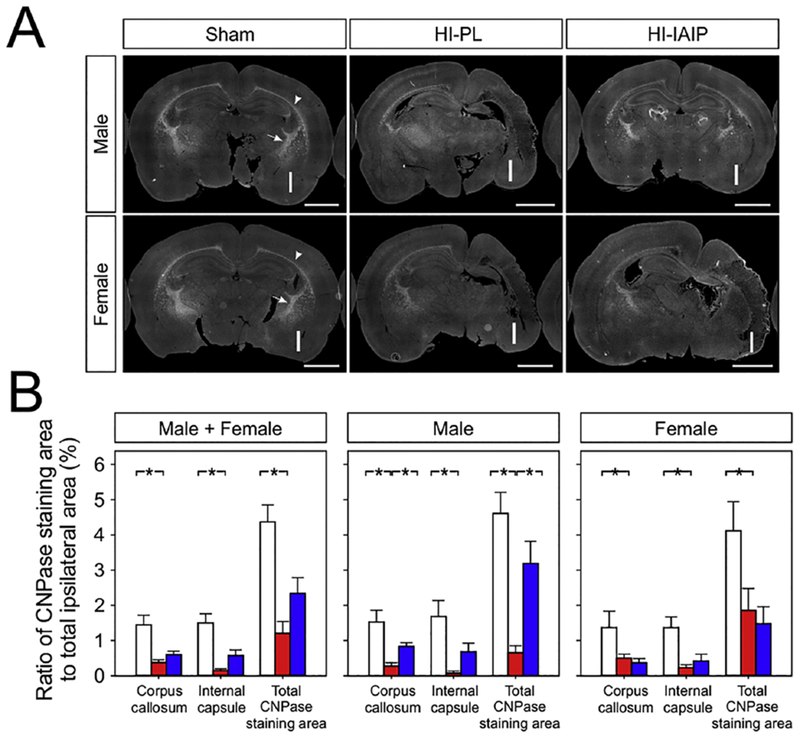
Fig. 10.

(A) Representative immunohistochemical stitched, 8-bit grayscale images containing CNPase-labeled cells of the Sham, HI-PL and HI-IAIP male (top row) and female (bottom row) neonatal rats. The “I” designates the side of the brain ipsilateral to the carotid artery ligation. The white, dashed arrows indicate the CNPase staining area in the internal capsule. The white arrowheads indicate the CNPase staining area in the corpus callosum. Scale bar = 2 mm. (B) The average percent ratio of CNPase-positive area to the total area ipsilateral to HI for the corpus callosum, internal capsule, and total hemisphere in the Sham, HI-PL and HI-IAIP groups for males + females, males, and females. Values are mean ± SEM. Sham: male n = 5, female n = 5; HI-PL: male n = 6, female n = 5; HI-IAIP: male n = 7, female n = 7. *P < 0.05.
