
Fig. 7.
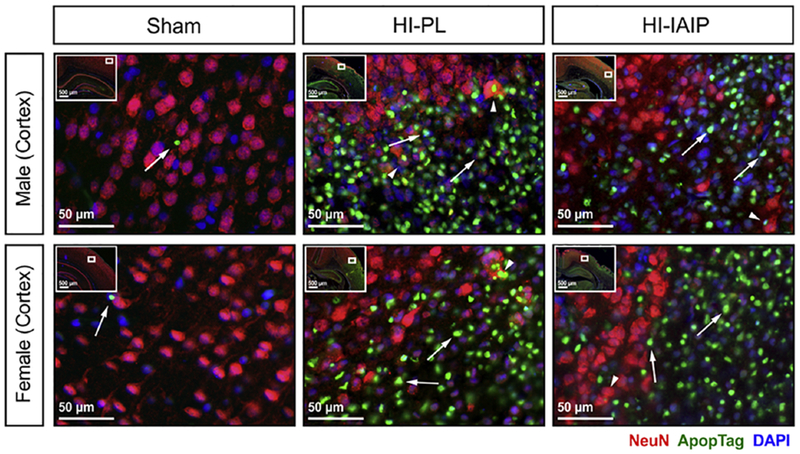
Representative immunohistochemical images containing NeuN- (red) and ApopTag-labeled (green) cells in the cerebral cortices of the Sham, HI-PL and HI-IAIP male (top row) and female (bottom row) neonatal rats. DAPI (blue) is utilized as a counterstain. The inset on each image identifies the area of the brain from which the image was taken. White arrows indicate ApopTag-labeled cells (ApopTag+). White arrowheads indicate ApopTag-positive and NeuN-positive cells.