
Fig. 8.
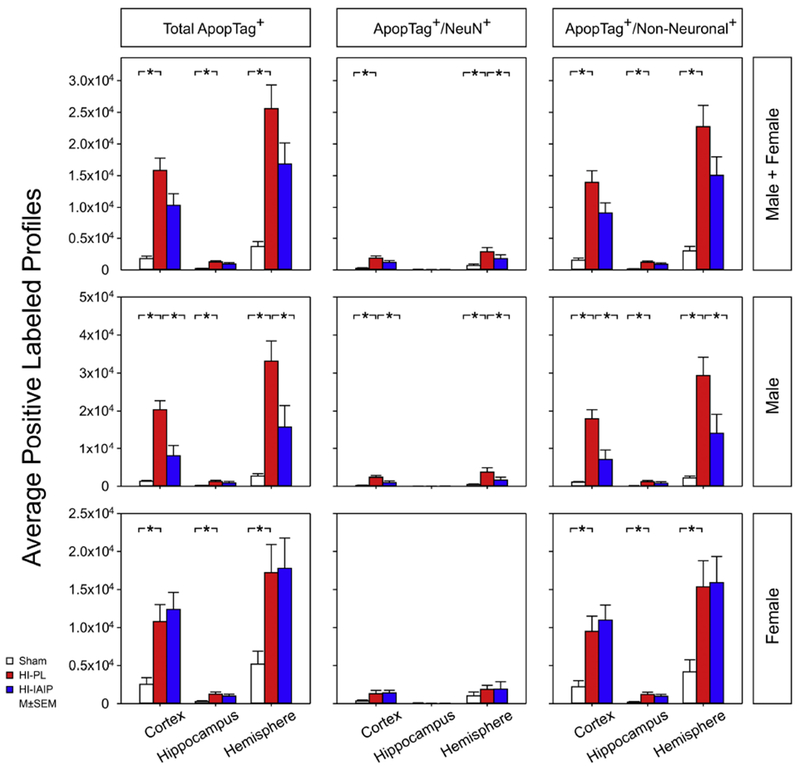
The average positive-labeled profiles of total ApopTag+, ApopTag+/NeuN+, ApopTag+/Non-Neuronal+ profiles for the cerebral cortex, hippocampus and total hemisphere in the Sham, HI-PL and HI-IAIP groups. Top panel reports data for males + females, middle panel for males, and bottom panel for females. Values are mean ± SEM. Sham: male n = 9–12, female n = 4–8; HI-PL: male n = 7–10, female n = 7–9; HI-IAIP: male n = 6–9, female n = 5–10. *P < 0.05.