
Figure 3: Results for the cohort of animals.
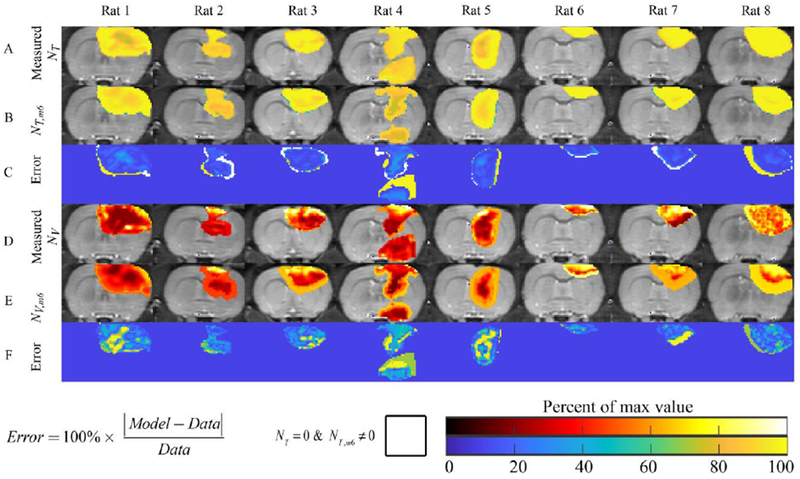
Results for the final time point, and central tumor slice, are shown for all eight rats. Row A shows the measured NT, while Rows B and C show NT,m6 and the error between the measurement and model, respectively. Rats 1-5 show varying degrees of intra-tumor heterogeneity in cell density, while rats 6-8 appear to have a relatively homogenous density of tumor cells. The NT,m6 model predicted the development of low-cell density regions (potentially necrosis) in all rats except rat 6. For rat 4, the NT,m6 model resulted in an under estimation of the amount of cells (~60% of carrying capacity, versus 90%) compared to the measured NT. Similarly, row D shows the measured NV, while Rows E and F show NV,m6 and the error between the measurement and model, respectively. In general, NV,m6 predicts increased blood volume fraction at the periphery of the tumor relative to the interior. For the vasculature model, high error (greater than 60%) is often observed in areas with low measured NV.