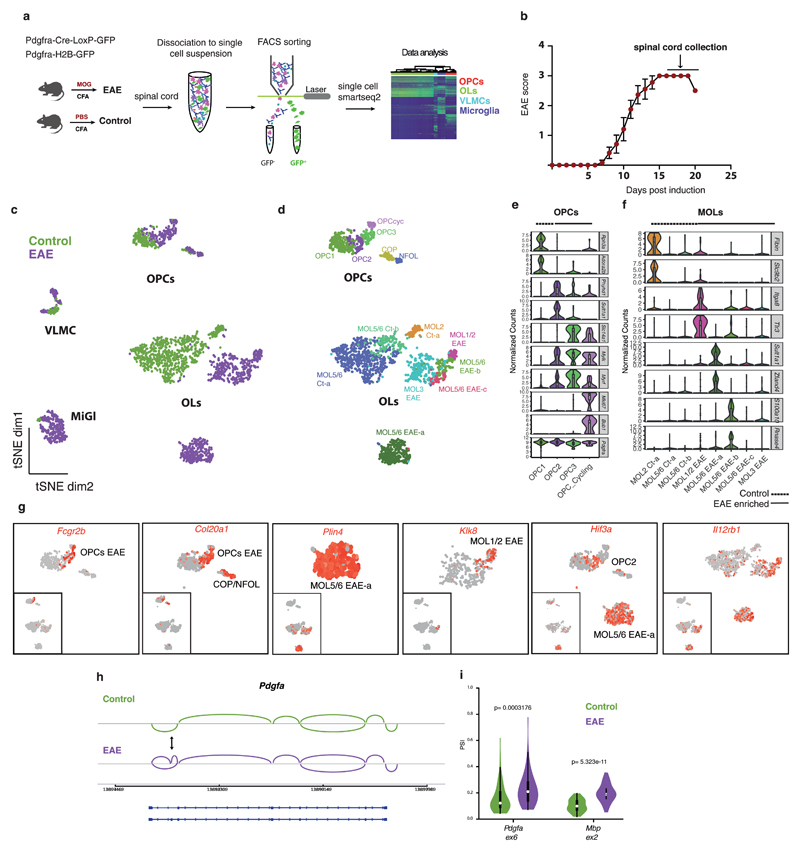
Figure 1. Single cell RNA-sequencing of oligodendrocyte (OL) lineage cells in response to experimental autoimmune encephalomyelitis (EAE) uncovers new disease-specific populations and disease markers.
a, Schematic overview of the methodology used to perform single-cell RNA-seq of the OL lineage cells. b, Clinical score of the diseased animals used in the study (n=12 mice; data represented as mean ± s.e.m.; only animals that reached score 3 and one that reached score 2.5 were used in this study). c, t-SNE plots of all cells sequenced showing the segregation of cells derived from Complete Freund's Adjuvant (CFA) controls and EAE (n=4 biologically independent mouse spinal cord samples per condition; total number of cells is 794 for controls and 971 for EAE). d, t-SNE plots of all cells sequenced representing different cell populations within OL lineage cells. Mature oligodendrocyte (MOL) identities were defined according to marker genes identified in ref. 4 (n=4 biologically independent mouse spinal cord samples per condition; total number of cells is 745 for controls and 707 for EAE). e-f, Violin plots depicting the expression of specific markers for OL precursor cells (OPC) (e) and for MOL clusters (f) (n=4 biologically independent mouse spinal cord samples per condition; total number of cells is 116 for OPC controls and 132 for OPC EAE and 626 for MOL controls and 575 for MOL EAE). Violin plots are centered around the median with interquartile ranges and shape represents cell distribution. g, t-SNE plots of disease-specific markers for OL lineage cells (n=4 biologically independent mouse spinal cord samples per condition; total number of cells is 745 for controls and 707 for EAE). h, Schematic representation of the exon 6 inclusion in the Pdgfa gene in response to EAE. i, Violin plot representing the PSI (proportion of spliced isoform) in controls (MOL2 Ct-a depicted in green) and EAE (MOL1/2 EAE depicted in purple) of the alternative spliced exons in Pdgfa and Mbp genes. PSI=0 means totally excluded and PSI=1 totally included (n=4 biologically independent mouse spinal cord samples per condition; total number of cells is 56 for MOL2 Ct-a and 49 for MOL1/2 EAE; Pdgfa ex6: p=0.0003176 and Mbp ex2: p=5.323e-11 by two-sided Wilcoxon rank sum test with continuity correction; Violin plots are centered around the median with interquartile ranges and shape represents cell distribution. VLMCs - vascular and leptomeningeal cells; MiGl - Microglia-like cells.

