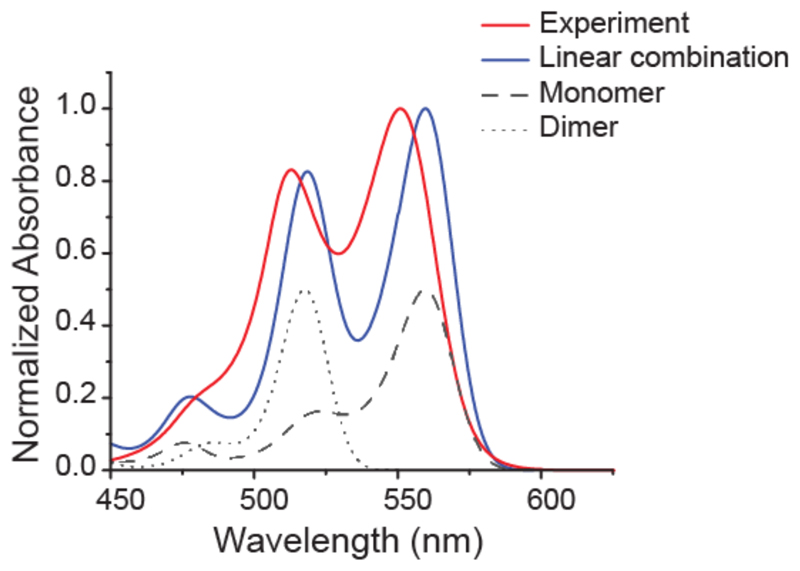
Figure 3.
Comparison of weighted linear combination of TD-DFT simulated spectra (solid red line) and experimentally obtained spectra from the construct “dimer 0” on dsDNA (solid blue line). Simulated spectra of monomer and dimer are shown in black (dashed and dotted lines corresponding to monomer and dimer, respectively). The intensities of the experimental spectra were fitted best when assuming one-third of dimer and two-third of monomer contribution.

