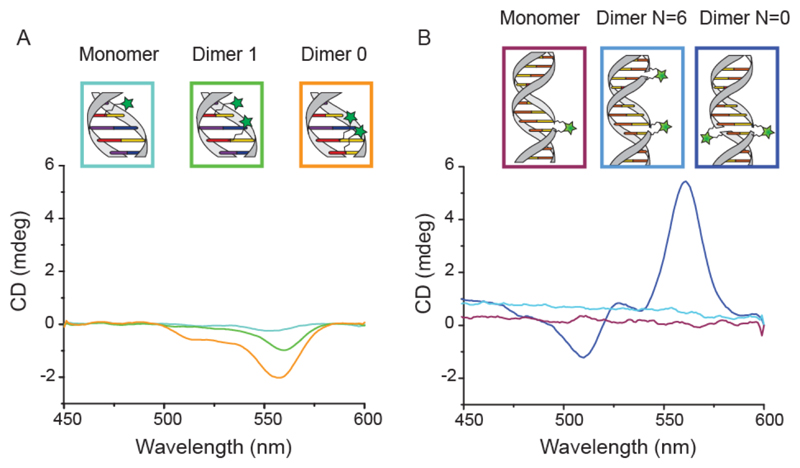
Figure 4.
CD measurements of all dsDNA constructs. A) Spectra of thymine-labeled Cy3-dsDNA constructs, showing an increasing CD signal as the distance between dyes decreases. B) Spectra of doubly labeled Cy3-dsDNA constructs, showing a CD signal for the dimer with 0 bases in between dyes and no signal for both the monomer and the dimer with 6 bases in between dyes.

