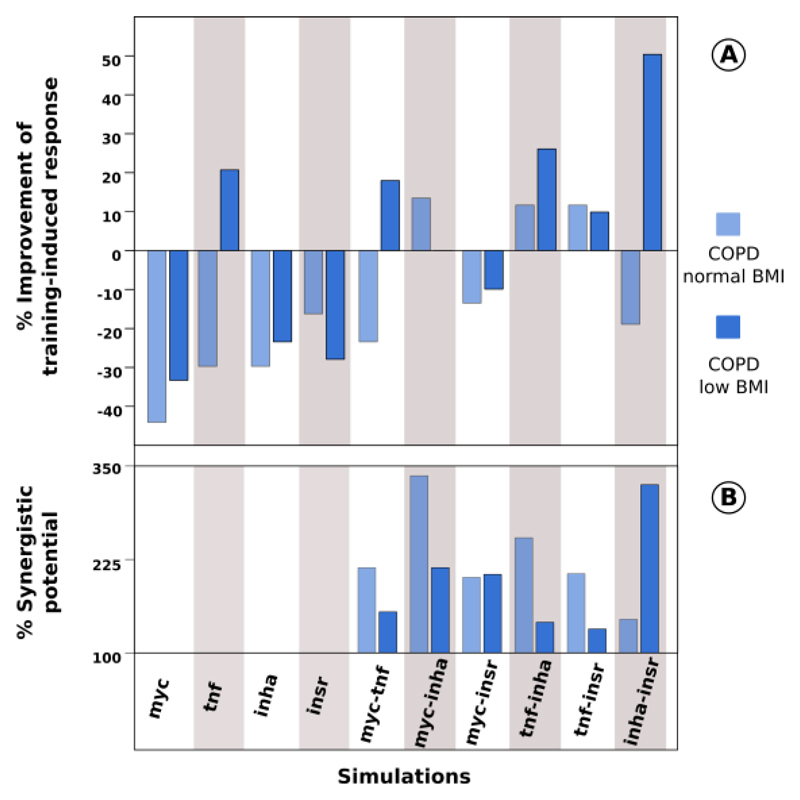
Fig. 2. Evaluation of potential therapeutic targets in COPD.
In the overall figure the first four columns represent the results of simulations on single target nodes and the six last correspond to simulations targeting pairs of nodes. Light and dark blue bars represent the results of the simulations of COPD patients with normal and low BMI, respectively Fig. 2 A: Evaluation of the % of improvement to training-induced response in both COPD groups compared with the results from table 2 and using as reference the response to training in control group. Fig. 1 B Evaluation of the % of synergistic potential compared with the expected additive effect.

