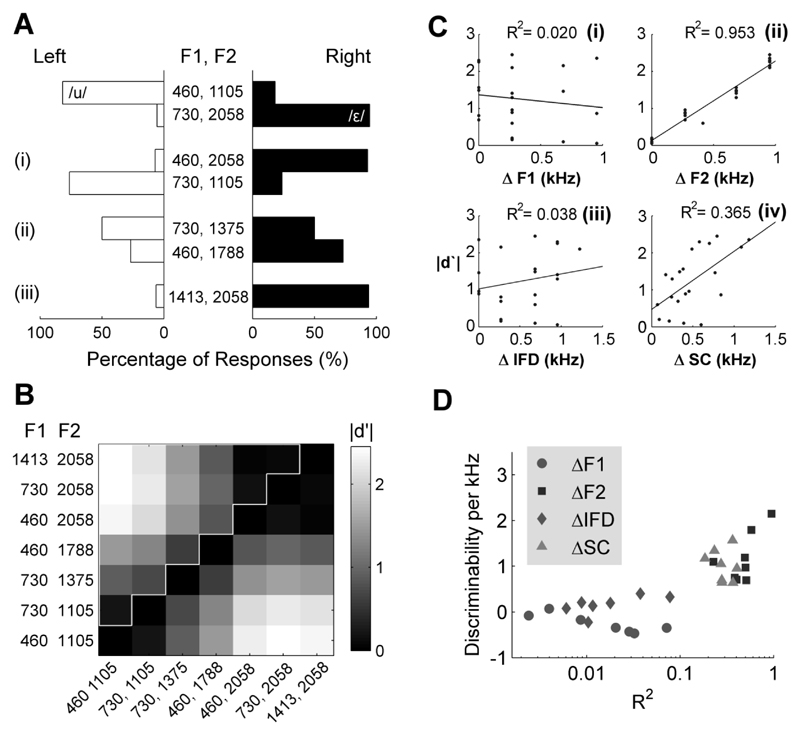
Fig. 3.
(A) Behavior of a ferret trained to respond to [u] and [ε] at the left and right spouts respectively. Top rows indicate the responses to training vowels ([u]: 82 trials; [ε]: 92 trials). (i) Responses to probe sounds in which F1 and F2 were mismatched (460, 2058 Hz: 43 trials; 730, 1105 Hz: 42 trials). (ii) Responses to probe sounds in which F1 and inter-formant distance were mismatched (730, 1375 Hz: 36 trials; 460, 1788 Hz: 41 trials). (iii) Responses to probe sounds in which F2 and inter-formant distance were mismatched (1413, 2058 Hz: 48 trials). (B) Discriminability matrix indicating how differently the ferret responded to all vowels presented. Each cell indicates comparison for one pair of vowels. Border indicates the set of unique comparisons used to correlate discriminability with spectral cues (see Figs 4 and 5). (C) Correlations between absolute discriminability (|d′|) of vowel pairs and differences between vowels in F1 (ΔF1)(i), F2 (ΔF2)(ii), inter-formant distance (ΔIFD)(iii) and spectral centroid (ΔSC)(iv). Each point represents one of the unique comparisons (cells above the diagonal) in Fig. 3B. (D) Population scatterplots illustrating the correlation coefficients (X-axis) and regression gradients (Y-axis) for all ferrets.

