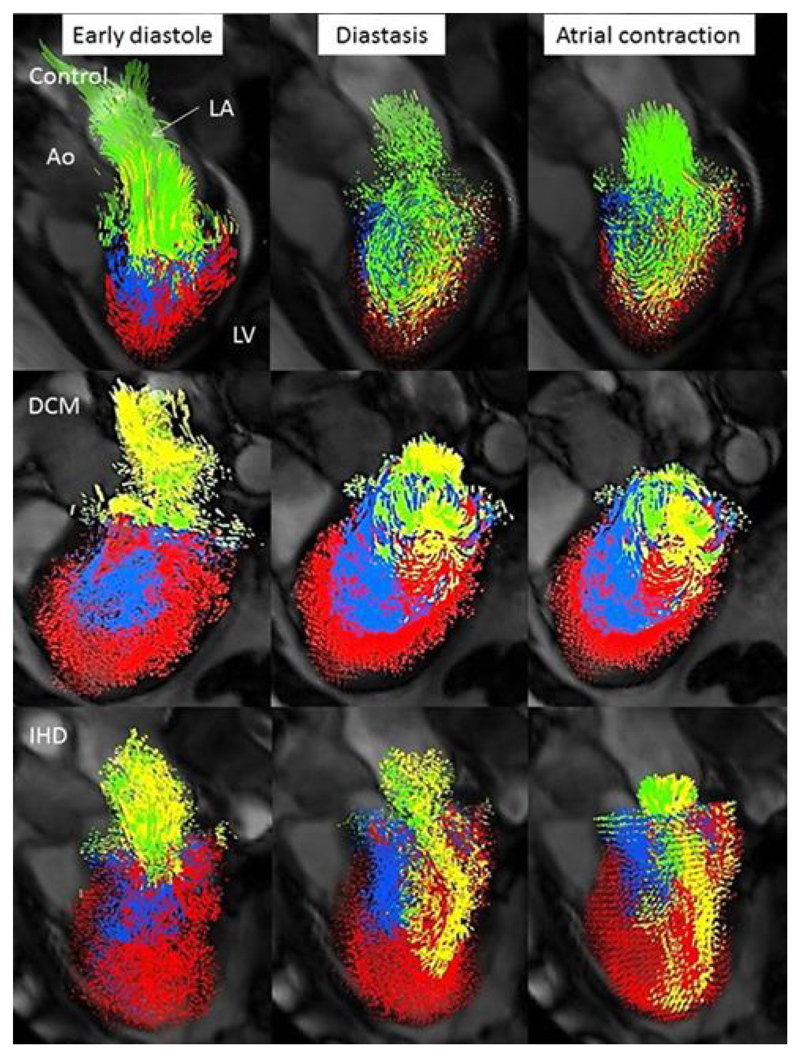
Figure 1. Representative diastolic LV visualisations in a control (direct flow 35%, residual volume 29%), DCM (direct flow 10%, residual volume 55%) and IHD patient with an antero-apical infarct (direct flow 8%, residual volume 56%).
Despite similar proportions of residual volume between the IHD and DCM patient the distribution differs; with a global distribution in the DCM patient and a more localised distribution in the IHD patient, corresponding to the area of infarction. Direct flow, green; retained inflow, yellow; delayed ejection flow, blue and residual volume, red. Ao, aorta; DCM, dilated cardiomyopathy; IHD, ischaemic cardiomyopathy; LA, left atrium; LV left ventricle.

