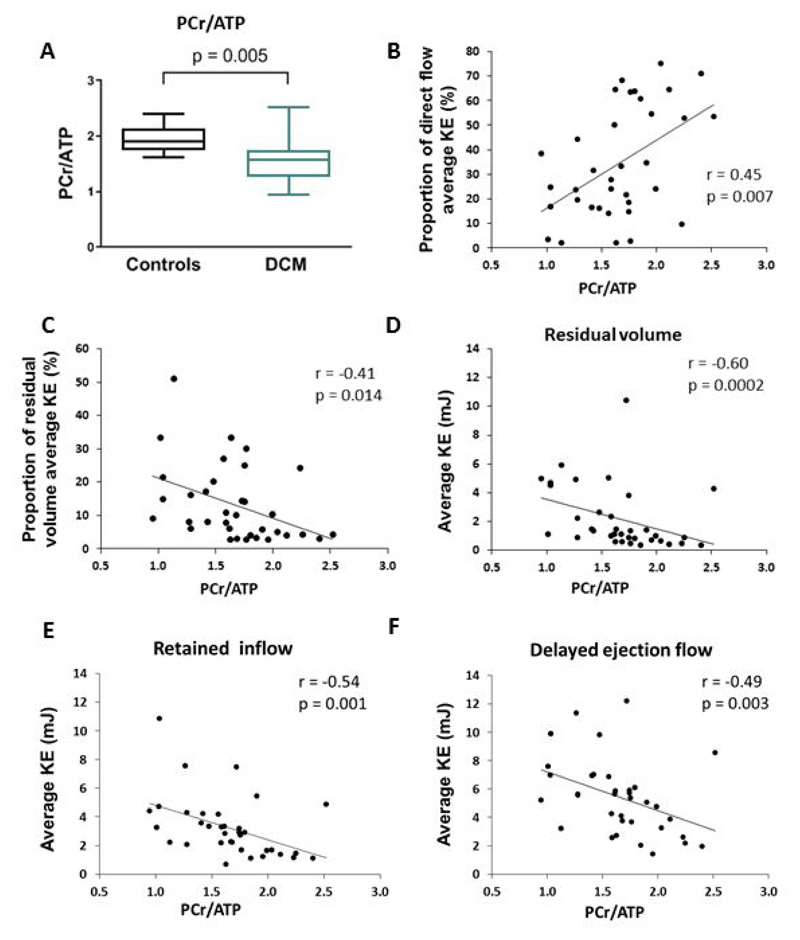
Figure 5. Myocardial energetics results and correlations in DCM patients. (A)PCr/ATP ratio in controls compared to DCM. Correlations between PCr/ATP ratio and (B)proportion of direct flow average KE; (C)proportion of residual volume average KE; (D)residual volume average KE; (E)retained inflow average KE and (F)delayed ejection flow average KE.
PCr/ATP, phosphocreatine to adenosine triphosphate concentration ratio; KE kinetic energy.

