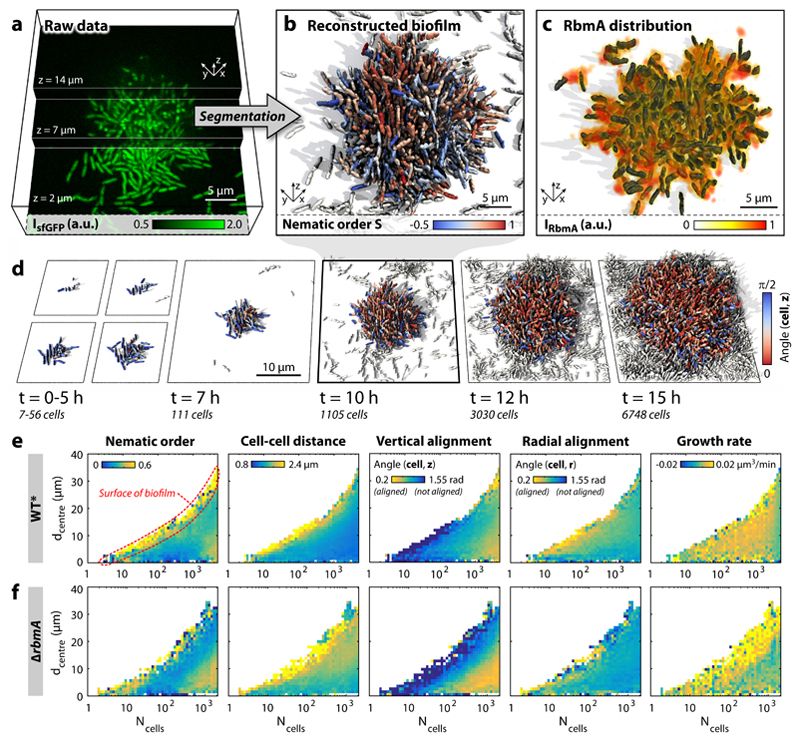
Figure 1. Dynamics of V. cholerae biofilm formation.
a, Cells constitutively expressing a green fluorescent protein (sfGFP) were imaged with spinning disc confocal microscopy. Images at three different z-planes are highlighted. b, 3D reconstruction of the biofilm shown in panel a, where each cell is coloured according to the nematic order parameter in its vicinity. High time resolution (Δt = 5–10 min) imaging allowed us to track cell lineages and discriminate cells (white) which are not direct descendants of the biofilm founder cell. c, The extracellular matrix protein RbmA mediates cell-cell adhesion and is distributed throughout the biofilm, as visualized by immunofluorescence. d, Time-resolved WT* biofilm growth series. Each cell is coloured according to the cellular alignment with the z-axis (for the ΔrbmA mutant see Supplementary Fig. 6). e-f, Heatmaps showing spatially resolved single-cell measurements of different biofilm structural properties inside WT* (e) and ΔrbmA (f) biofilms, which are used to characterize biofilm formation (n > 3 biofilms, standard deviations are shown in Supplementary Figs. 5 and 7 and the differences among both strains are highlighted in Supplementary Fig. 8), as a function of the distance to the biofilm centre (dcentre) and the number of cells inside the biofilm (Ncells).

