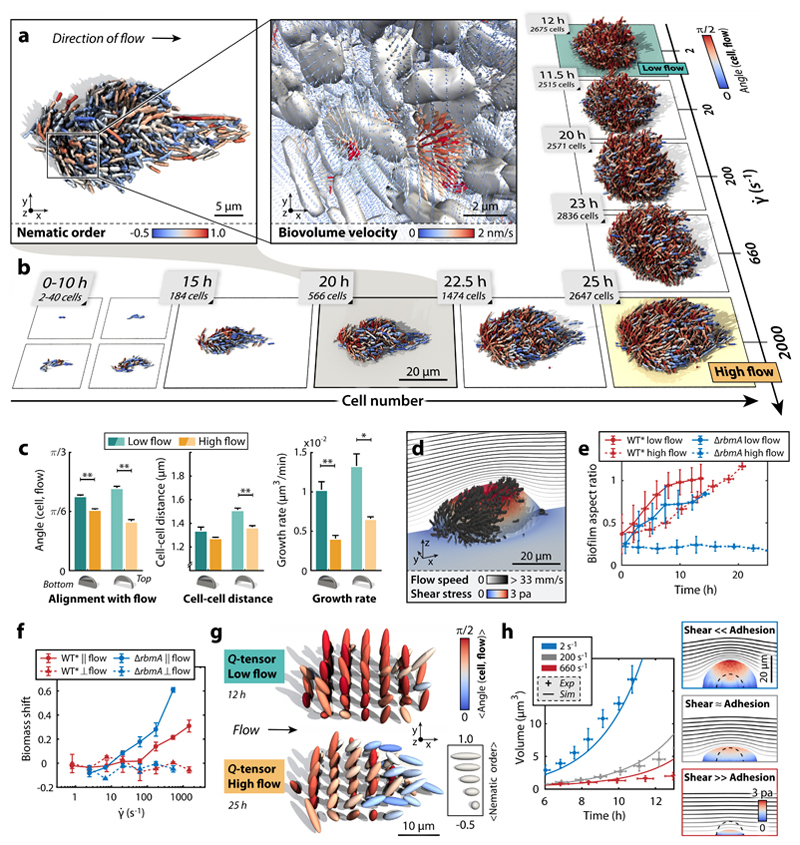
Figure 3. Biofilm architecture is shaped by external shear flow.
a, WT* biofilms grown under strong shear display droplet-like shapes. Inset: Biovolume flux field inside the biofilm (see Supplementary Information). b, WT* biofilms in high shear display strong alignment with flow throughout growth, yet biofilms grown in flow with low shear do not show strong architectural modifications. c, Quantification of the effect of shear on biofilm architecture: measurements of cellular alignment with flow, cell-cell distance, and cell growth rate at the bottom and top of biofilms with sizes of Ncells ~800 cells show that WT* biofilms in high shear are smaller, more compact, and display stronger flow-alignment. Statistical significance: * is p < 0.05 and ** is p < 0.01 (t-test); error bars are standard error (n = 4 biofilms, error bars: standard errors). d, Simulated shear stress distribution for a WT* biofilm, demonstrating that the region of highest shear is at the top of the biofilm. The streamlines indicate the profile of the external flow. e, Biofilm aspect ratio (height/width) increases in time for WT* (red) biofilms, but decreases for ΔrbmA mutant biofilms (blue) in high flow owing to shear-induced erosion (n = 4, error bars: standard deviations). f, Biomass shift is defined as the fraction of the average total biomass flux through planes parallel (‖) or perpendicular (⊥) to flow (see Supplementary Fig. 2 for details). Positive biomass shift along the flow direction at higher shear rates indicates anisotropic biofilm expansion towards the downstream direction of the external flow. Zero biomass shift perpendicular to the flow indicates no directional bias (n ≥ 3, error bars: standard errors). g, The tensorial nematic order parameter (Q-tensor, see Supplementary Information) and cellular alignment with the flow direction were measured at equally spaced points inside biofilms at low and high shear rates, indicating the regions in which cells are predominantly aligned with the flow and each other. h, Biofilm volumetric growth for ΔrbmA mutant biofilms is captured by a continuum model (see Supplementary Information) with varying ratios of shear-induced erosion and cell-cell adhesion (experiment: n = 4, error bars: standard deviations).

