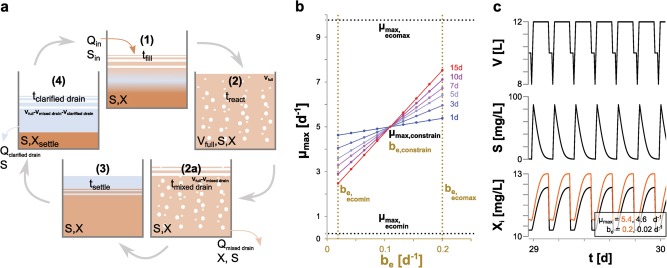
Fig. 1.
a Schematic diagram of the SBR used when running the model. All parameters are detailed in Table 1. b Iteratively solved 9 point persistence curves for the maximum growth rate (µmax) and endogenous decay (be) selection range at 1, 3, 5, 7, 10, and 15 days MRT. Constraints are placed on the range of maximal growth rates (μmax,eco; 0.2–9.8 d−1) and endogenous decay constants (be,eco; 0.02–0.2 d−1), defining the ecological space available. The model uses controlling growth parameters (µmax,constrain, be,constrain) of 5 and 0.11 d−1, respectively. c Example of the steady-state output for the volume, substrate concentration, and two biomasses for the 1 d MRT

