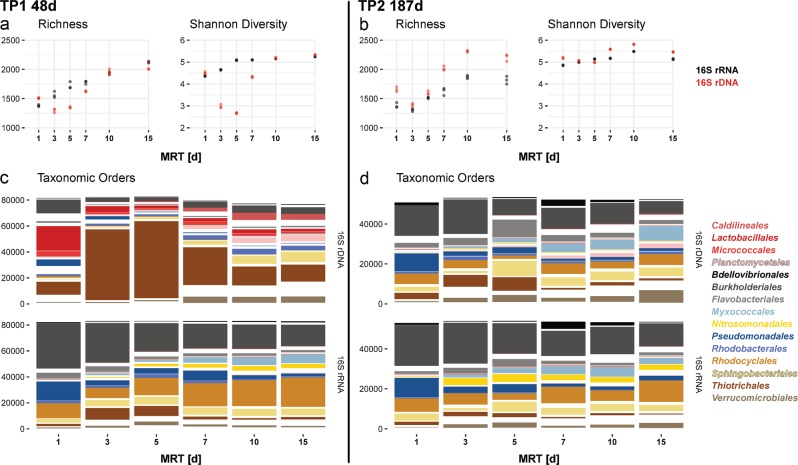
Fig. 2.
a, b The calculated diversity metrics for the rarified B2-primer amplified 16S rRNA (black) and rDNA (red) data. c, d The abundance data distributed into taxonomic orders; the top 10 of the sums across each time-point and source (cDNA or gDNA) were assigned a color, resulting in 15 orders being represented overall. A replicate analysis is presented for the alternate B1 primer in Supplemental Figure 16

