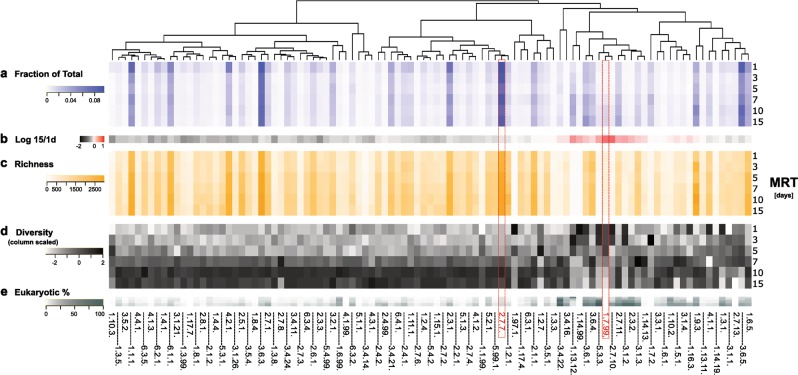
Fig. 5.
Summary of the sub-subclass Enzyme Commission (EC) numbers across the MRT gradient averaged between TP1 and TP2 samples that exceed 10,000 normalized reads in at least 1 reactor (n = 99). The heatmaps are organized hierarchically according to a Euclidean distance and Ward clustering of the scaled EC fraction across the MRT gradient. (a) Total relative abundance. (b) The 15/1 d MRT abundance log ratio. The within EC sub-subclass taxonomic (c) richness and (d) Shannon diversity metrics were calculated based on the Uniport identifiers of the organism of origin at the genus level that provided the annotation to the reads. (e) The fraction of the total reads that were annotated per EC sub-subclass originating from an eukaryotic sequence in the Uniprot database. Note: The red dashed boxes highlight the 2.7.7 and 1.7.99 EC numbers. The full sub-subclass and top 50 EC numbers heatmaps for both TP1 and TP2 samples are presented in Supplemental Figures 17 and 18

