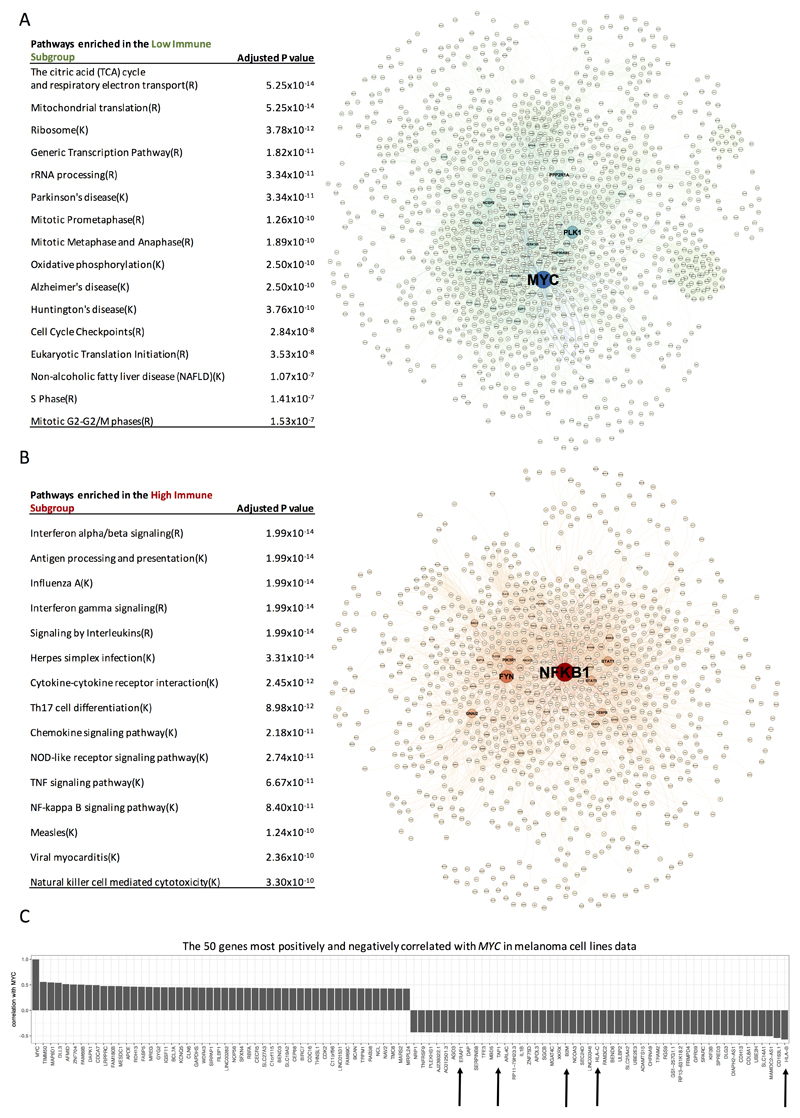
Figure 3. Identification of “hub” genes and enriched pathways in the network analyses.
(A) The most enriched pathways in the Low Immune Subgroup, in the network. Protein-protein interaction network of genes upregulated in the Low Immune Subgroup. (B) The most enriched pathways in the High Immune Subgroup, in the network. (K=KEGG, R=Reactome). Protein-protein interaction network of genes upregulated in the High Immune Subgroup. The size of nodes (protein from the interaction network) indicates the importance in the network (betweenness). (C) The 50 genes most positively and negatively correlated with MYC in melanoma cell lines data (Spearman’s rank correlation). The arrows point to the genes coding for proteins involved in antigen processing and presentation via HLA.

