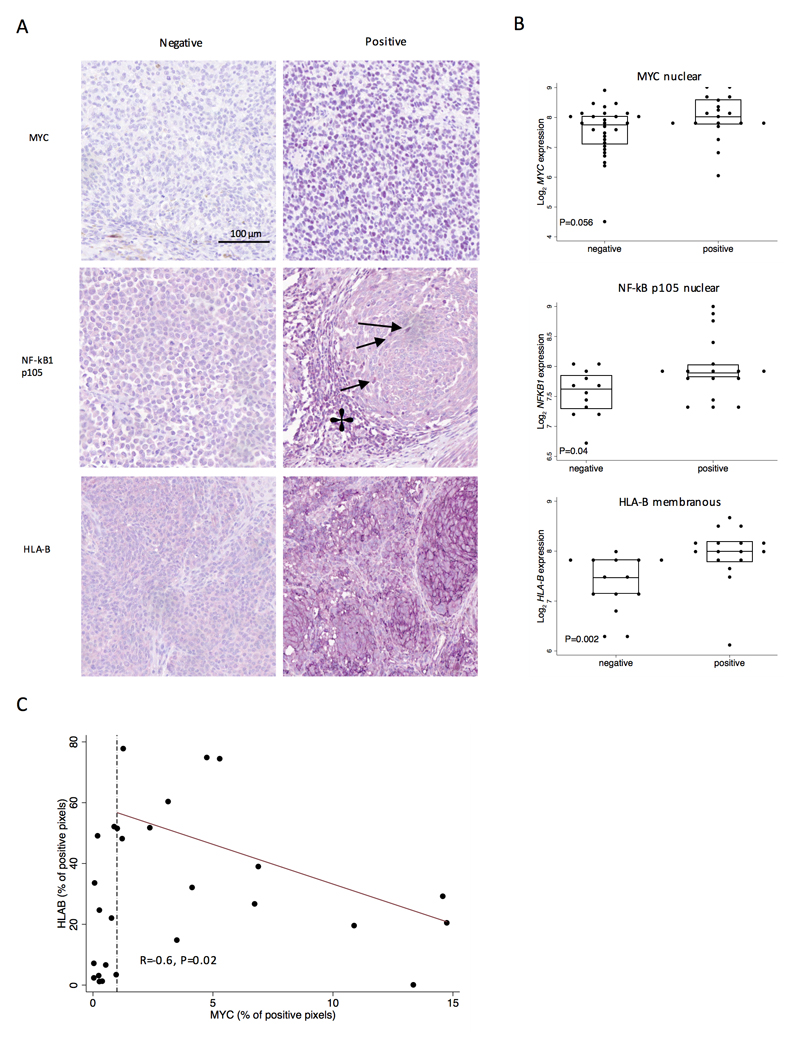
Figure 4. Gene expression levels correlate with protein scores - Immunohistochemistry (IHC).
(A) Representative images of positive and negative staining for MYC (nuclear), HLA-B (membranous), NF-κB p105 (Tumor and TILs nuclei), 20x magnification. (B) Dot and box plots show comparisons of mRNA level (y axis) and staining level (x axis), using Mann-Whitney U test (MYC: N=48, HLA-B: N=30, NF-κB p105: N=29). NF-κB p105 nuclear staining is indicated by arrows, NF-κB p105 in tumor infiltrating lymphocytes by a star. Purple chromogen was used for staining, therefore the color representing the positive staining is lavender-purple. (C) The scatter plot represents the scoring values for HLA-B (percentage of positive pixels for chromagen in outputs from Nuance software) on the y-axis and on the x-axis MYC (percentage of positive pixels for both haematoxylin and chromagen). The dashed line indicates MYC detection at less than 1%, which we considered as very low/absent expression. The red line is fitted for the MYC values higher that 1% of positive pixels.

