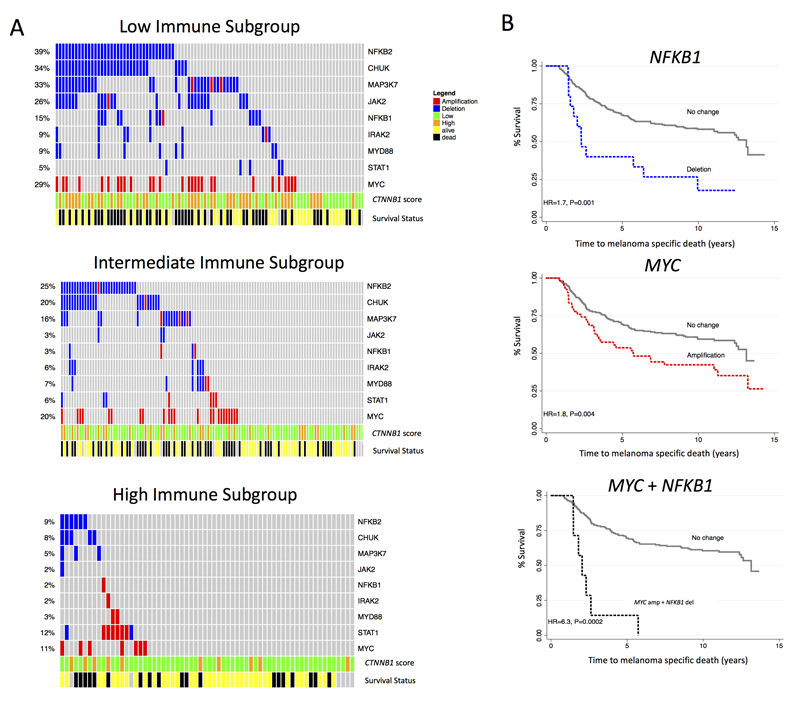
Figure 5. MYC is amplified while NF-κB and IFN-γ signaling genes are deleted in the Low Immune Subgroup.
(A) Oncoprint figure for Low, Intermediate and High Immune group representing CNA of MYC, NF-κB and genes in the IFN-γ pathway with annotation of CTNNB1 expression and survival status. (B) Kaplan Meier plots for participants whose tumors showed MYC amplifications, NFKB1 deletions, and for a combination of MYC and NFKB1 CNAs in the whole dataset. Hazard ratios were calculated using the univariable Cox proportional hazard model.

