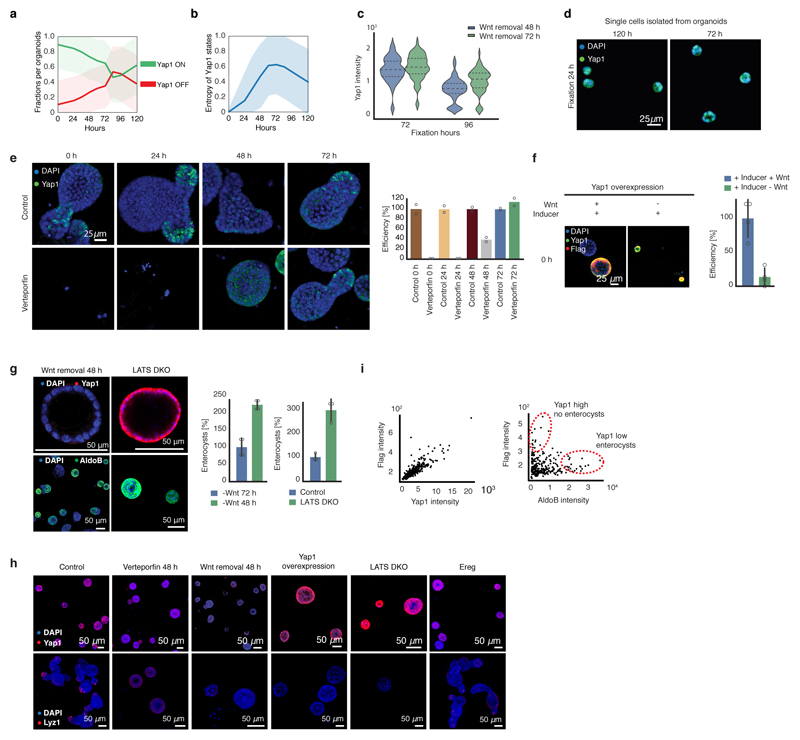
Extended Data Figure 7. Yap1 is necessary but not sufficient for organoid formation.
a, Fraction of cells per organoid having Yap1 in ON state (green, nuclear localization) or in OFF state (red, cytoplasm localization) over time (n=1074 organoids). b, Entropy of Yap1 states (i.e. variability in Yap1 activation ON and OFF state) over time (n =1074 organoids). (a, b) Shades show s.d. c, Quantification of Yap1 mean intensity after Wnt removal at 48h or 72h in organoids fixed at 72h or 96h (n=4 replicates). Violin plot lines show quartiles. d, Images of organoids derived from single cells isolated from organoids at 72h or at 120h. e, Organoids treated at different time points with control or with Verteporfin. Fixation at 96h. Left: representative images, right: efficiency quantification (normalization: control, n=2 replicates). Barplots: mean. f, Yap1 overexpressing organoids with or without Wnt. Fixation at 96h. Left: representative images, right: efficiency quantification (normalization: control, n=4 replicates, two-sided t-test, p-value 0.001). g, Left: images of organoids with Wnt removal at 48h or LATS DKO. Top-row: fixation at 72h. Bottom-row: fixation at 96h (Wnt removal 48h) or 120h (LATS DKO). Right: quantification of enterocysts as retrieved in the left panel. (n=4 replicates for Wnt removal 48h and two-sided t-test, p-value 0.0001, n=3 replicates for LATS DKO and two-sided t-test p-value 0.002). h, Representative images of control, Verteporfin treatment at 48h, Wnt removal at 48h, Yap1 overexpression, LATS DKO or treatment with Ereg. Top-row: Fixation at 72h. Bottom-row: Fixation at 96h (Wnt removal 48h, Yap1 overexpression, LATS DKO) or 120h (control, Verteporfin 48h, Ereg). i, Scatterplot of Flag mean intensity signal and Yap1 mean intensity signal (left) and of Flag mean intensity and AldoB mean intensity (right) in Yap1 overexpressing organoids at 96h. (f, g) Barplots: mean ± s.d.

