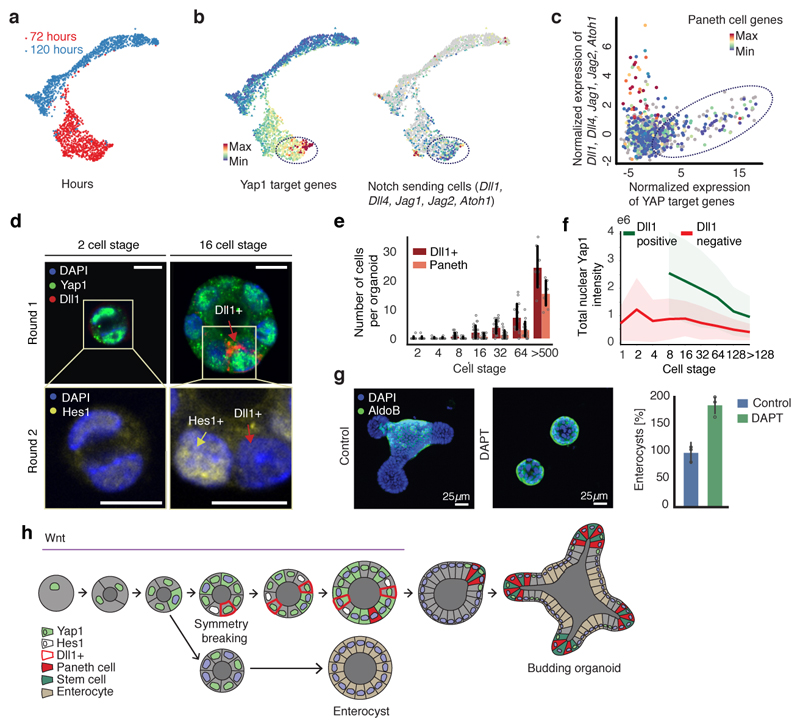
Figure 5. Yap1 cell-to-cell variability allow Notch/Dll1 activation and symmetry breaking.
a, Griph-based visualization (72h and 120h) of single cells. b, Single-cell expression of Yap1 targets and Notch ligand. Dotted square: high Yap1 targets expressing cells. c, Spearman correlation between Yap1 target genes and Notch ligand expression at 72h (n=798, n=cells). d, Multiplexed imaging Yap1 variability and Dll1+ cells. Upper panel: nuclei, Yap1 (green), Dll1(red). Lower panel: nuclei and Hes1 (yellow). Arrows: Red (Dll1+ cells), yellow (Hes1+). Scale bar=10 μm. e, Number of Dll1+ and Paneth cells (n=170, n=organoids). f, Nuclear Yap1 intensity in Dll1+ (green) and Dll1- (red) cells (n=73899, n=cells). Shadows: s.d. g, Left panel: images of organoid treated with DAPT. Fixed 96h. Right panel: quantification of fraction of enterocysts (normalization: control). Fixed 96h (n=3, n=replicates, two-sided t-test, p-value 0.003). h Model of organoid development and symmetry breaking. (e, g) Barplots: mean ± s.d.

