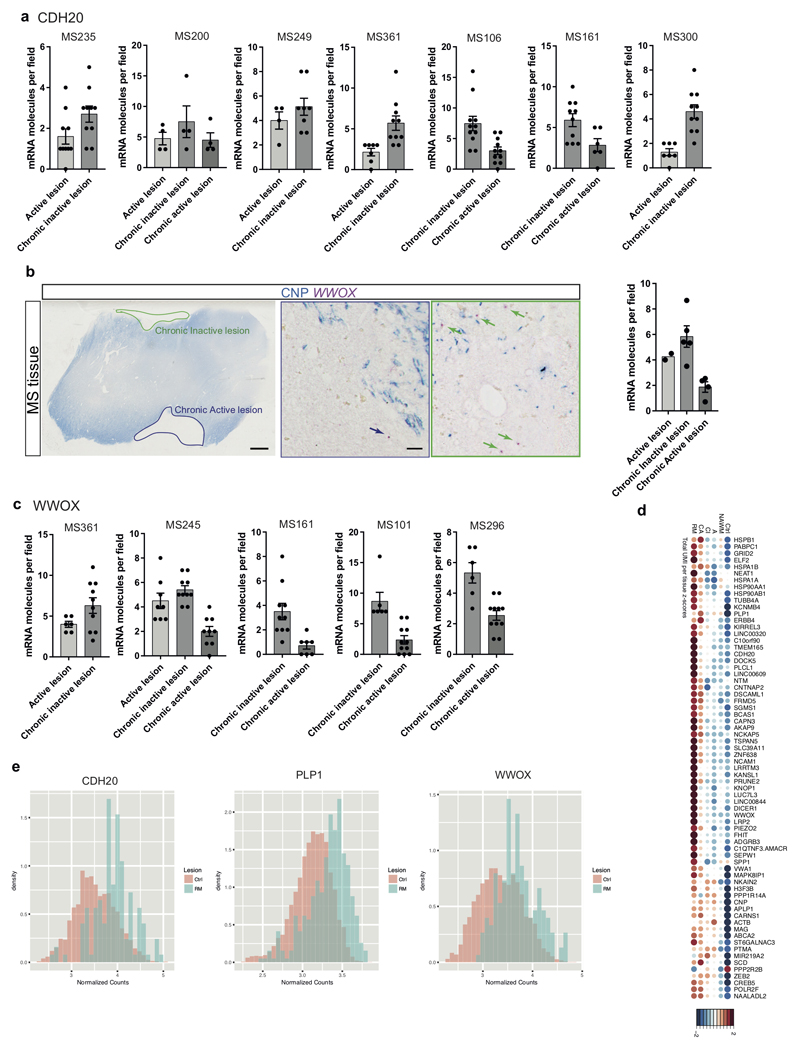
Extended Figure9. Validations of altered OL heterogeneity in MS and mRNA expression differences in lesions.
a, Quantification of BaseScope in-situ hybridization of CDH20 (mRNA) in individual MS patients (corresponds to Fig. 4c) shows an enrichment in chronic inactive lesions in each individual (n= individual number of quantified fields per patient (n=7): MS235: n=10 for A and CI lesions, MS200: n=4 for A, CI and CA lesions, MS249: n=4 for A and n=8 for CI lesions, MS361: n=7 for A and n=10 for CI lesions, MS106: n=11 for CA and CI lesions, MS161: n=6 for CA and n=10 for CI lesions, MS300: n=7 for A and n=10 for CI lesions, data displayed as mean ± SEM). b-c, BaseScope in-situ hybridization of WWOX (mRNA) shows depletion of detected mRNA in CA lesions on average (b) and in individual MS patients (c) (scale bars: 2mm, 20µm, b: n=2 for active lesions and n=4 for chronic inactive and chronic active lesions, data displayed as mean ± SEM, ANOVA, c: dots display the individual number of quantified fields per patient (n=5), MS245: n=8 for A, n=10 for CI and n=9 for CA lesions, MS361: n=6 for A and n=10 for CI lesions, MS101: n=6 for CI and n=11 for CA lesions, MS161: n=10 for CI and n=7 for CA lesions, MS296: n=11 for CA and n=6 for CI lesions, data displayed as mean ± SEM). d, Dotplot of the total normalized RNA UMI counts found within the lesions, NAWM and controls, where both size and color indicate z-scores blue and large: low; red and large: high; small: intermediate). e, Density histograms showing the difference in distribution of normalized counts observed between control and remyelinated lesions.

