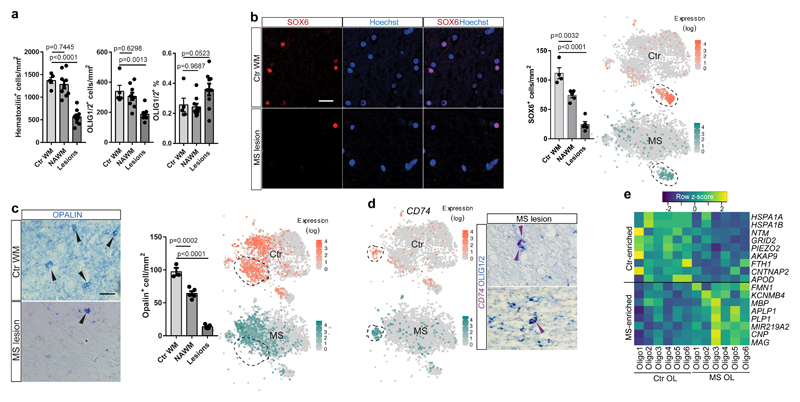
Figure3. Depletion of specific OL sub-clusters and increased expression of myelination genes in mature OLs in human MS brain.
a, Total cellular and OL densities in Ctr WM, NAWM and MS lesions (data displayed as mean ± SEM, n=5 Ctr individuals, n=9 MS individuals, ANOVA). b, SOX6-expressing OPCs in Ctr WM, NAWM and MS lesions (scale bars 50µm, data displayed as mean ± SEM, n=4 Ctr individuals, n=5 MS individuals, ANOVA) and tSNE overlay of SOX6 expression in the Ctr and MS snRNA-seq dataset. c, OPALIN-expressing OL in Ctr WM, NAWM and MS lesions (scale bar: 50µm, data displayed as mean±SEM, n=3 Ctr individuals, n=5 MS individuals, ANOVA) and tSNE overlay of OPALIN expression in the Ctr and MS snRNA-seq dataset. d, CD74 expression in the Ctr and the MS snRNA-seq dataset and BaseScope in-situ validation of presence of CD74 combined with IHC staining for Olig1/2+ OLs (n=2 different MS patients, experiments were performed in 2 independent batches). e, Heatmap representing the average gene expression of a subset of genes, including myelin-related genes, in mature OL in Ctr vs. MS samples). For tSNEs and heatmap, n=4037 OL in Ctr and n=4737 OL in MS for all t-SNE projections). a-c: only p-values compared to Ctr are displayed.

