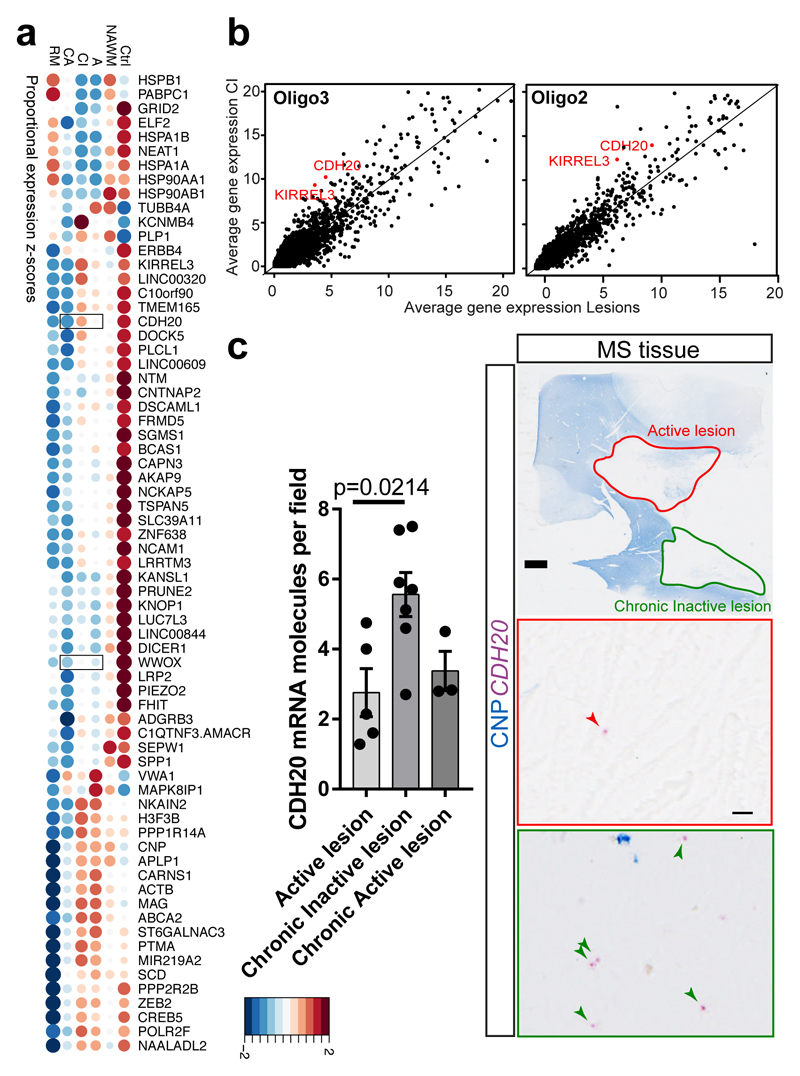
Figure4. Differential gene expression analysis of MS lesions reveals potential specific markers.
a, Dotplot illustrating the top differentially expressed genes (in terms of percentage of cells expressing these genes per sample) between lesions, NAWM and control; both size and color indicate z-scores (blue and large: low; red and large: high; small: intermediate). Validated genes CDH20 and WWOX are highlighted with squares. b, Average gene expression across Oligo2 (left) and Oligo3 (right) in chronic inactive (CI) lesions compared to the average expression in the rest of the lesions. In red: examples of genes significantly differentially expressed and upregulated in CI lesions (Bonferroni corrected Wilcoxon Rank Sum two-sided test, adjusted p-val <0.05). c, BaseScope in-situ validation of CDH20 expression in different lesion types (scale bars: 2mm, 10µm, data displayed as mean±SEM, n=5 active lesions, n=7 chronic inactive and n=3 chronic active lesions derived from n=7 different MS patients, ANOVA, only significant p-values are displayed). Abbreviations: NAWM (normal appearing white matter), active (A), chronic active (CA), chronic inactive (CI) and remyelinated (RM).

