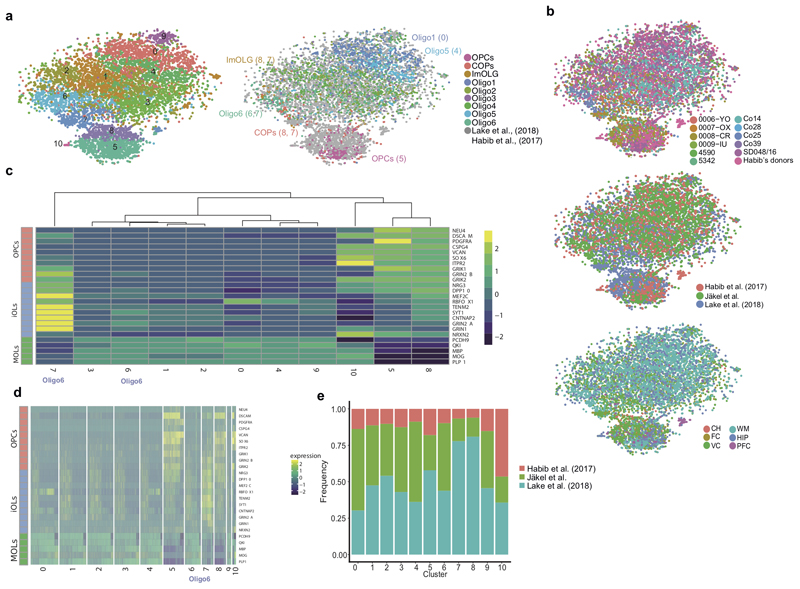
Extended Figure2. Quality control of snRNA-seq dataset reveals similar depth to previous datasets, and combination with other human brain snRNA-seq datasets identifies Oligo6 as an intermediate OL state.
a, tSNEs representing OL lineage clusters when performing clustering analysis with the combination of the three datasets (left) and assigning cell identity according to the clusters identified in Fig.1 (right, in brackets, the numerical cluster identity with the dataset combination, as indicated in the left tSNE) (n= number of nuclei, nCluster0=1445, nCluster1=1406, nCluster2=1355, nCluster3=1299, nCluster4=1150, nCluster5=1068, nCluster6=828, nCluster7=605, nCluster8=59, nCluster9=250, nCluster10=28). b, tSNEs indicating the cell origin when combining the current snRNA-seq dataset with Habib et al., 2017 and Lake et al., 2018 snRNA-seq datasets sorted by different individuals (top), different datasets (middle) and different regions (bottom) (n=9493 nuclei). c-d, Heatmaps representing expression of genes associated with intermediate states across the oligodendroglial lineage (as defined by Lake et al., 2018) at a cluster (c) and individual cell (d) level. e, Frequency distribution of identified oligodendroglia between different datasets.

