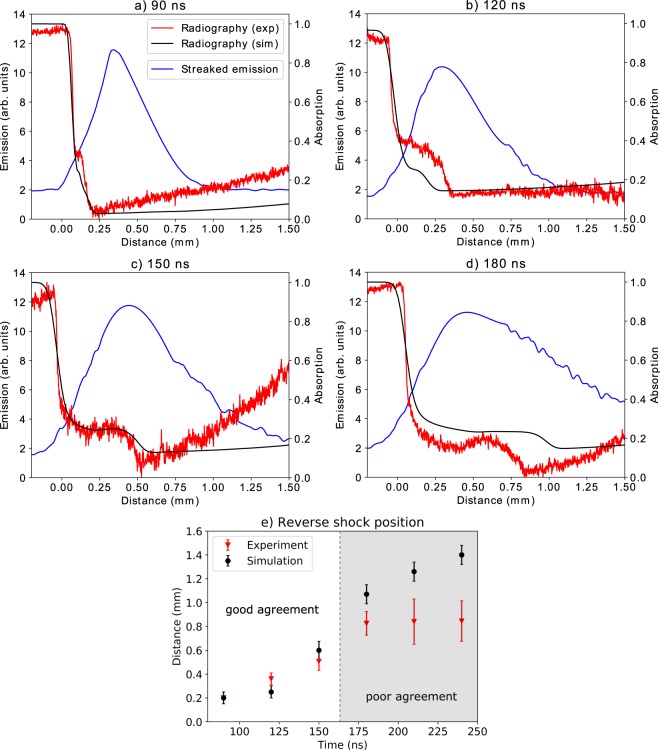
Figure 6.
Lineouts taken from experimental and simulated X-ray radiographs as well as from the streaked optical emission diagnostic at four different times. The origin represents the obstacle vacuum interface, with positive values indicating the direction of propagation of the reverse shock. Also shown is the position of the reverse shock front as a function of time as measured by the simulations and experiment. The two cases begin to diverge from 180 ns onwards, with the experimental shock remaining stationary.

