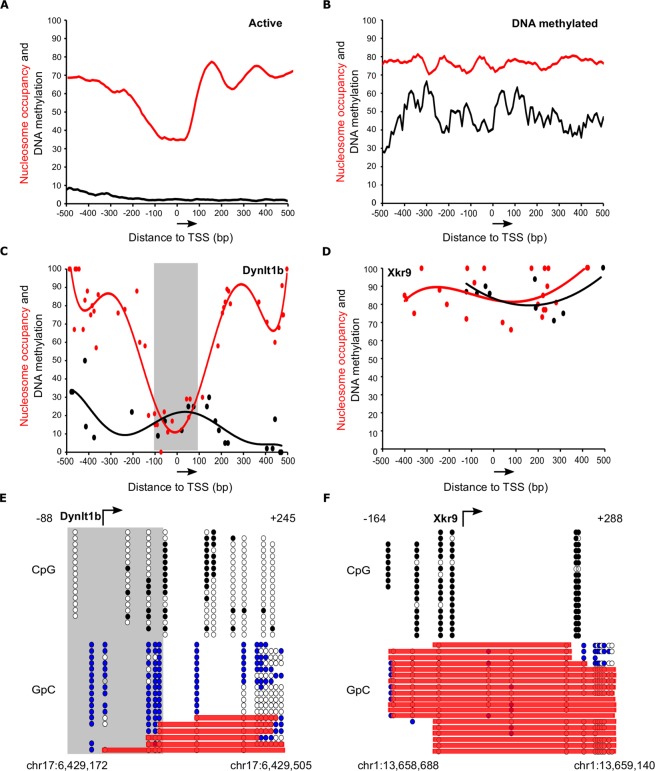
Figure 3.
Single molecule analysis of Dynlt1b and Xkr9 gene promoters using genome-wide NOMe-seq followed by NOMePlot in mESCs. (A,B) Population-averaged plots showing nucleosome occupancy (red, percentage of unmethylated GpCs) and DNA methylation (black, percentage of methylated CpGs) relative to the TSS (±500 bp) for transcriptionally active genes (n = 2512) (A) and DNA methylated silent genes (n = 1080) (B) in mESCs. Arrow indicates the direction of transcription. (C,D) Scatter plots with trendline showing population-averaged nucleosome occupancy (red) and DNA methylation (black) relative to the TSS of an active gene (Dynlt1b) (C) and a DNA methylated silent gene (Xkr9) (D). Nucleosome occupancy is calculated as the percentage of unmethylated GpC sites. DNA methylation is plotted as the percentage of methylated CpG dinucleotides. Arrow indicates the direction of transcription. (E,F) Lollipop diagram showing DNA methylation and nucleosome occupancy at the single molecule for Dynlt1b (E) and Xkr9 (F). Top panels show cytosine methylation at CpGs (white for unmethylated, black for methylated) and bottom panels show methylation patterns at GpC dinucleotides (white for unmethylated, blue for methylated). Red bars highlight GpC unmethylated regions long enough to accommodate a nucleosome. NDRs are marked with a grey box. Genomic coordinates of the analyzed regions are indicated.

