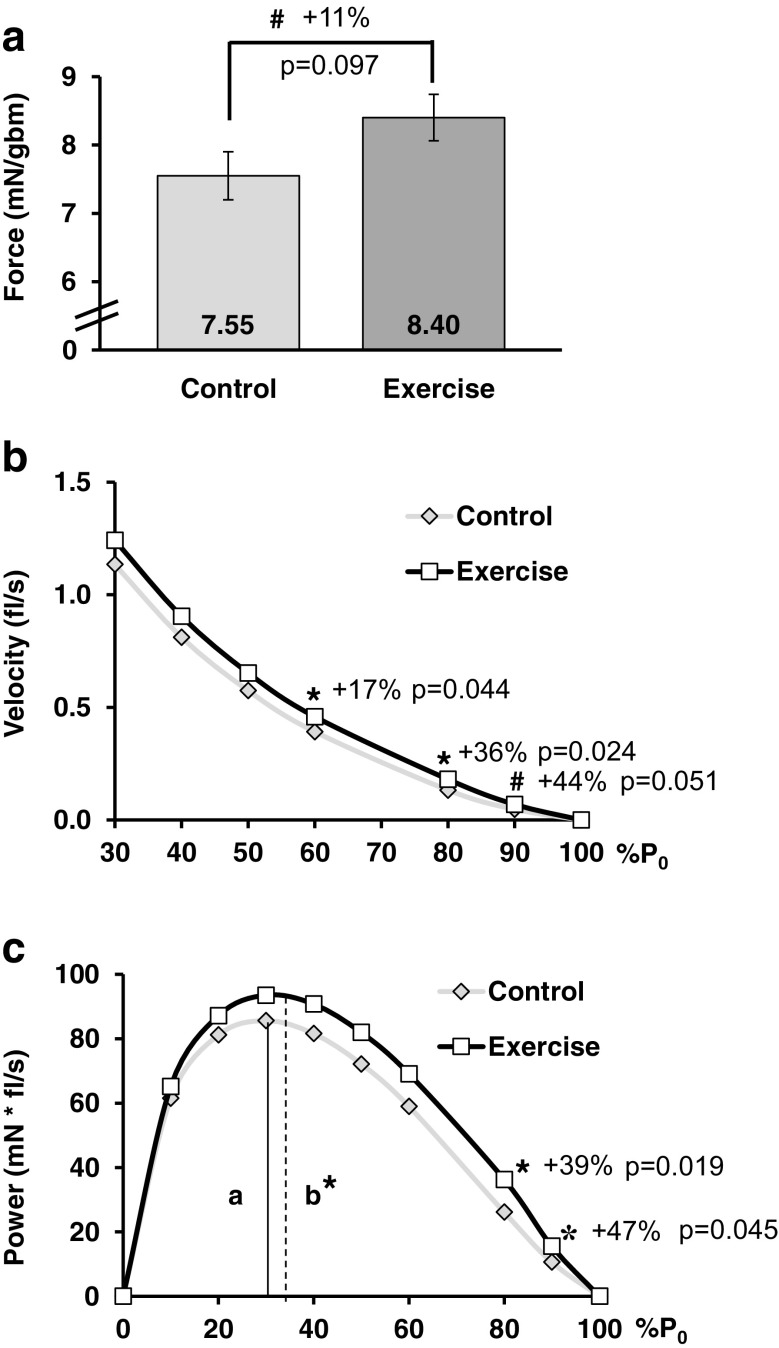
Fig. 4.
Training improved SOL contraction. a Soleus muscle normalized force (mN/gbm) tended to increase. b Contractile velocity increased under heavy load (curve displayed truncated at 30% P0 to highlight differences, no difference from 0 to 20%). c Power output improved under heavy load. a, b %P0 at Pmax for control and exercise, respectively. Symbols: *p < 0.05, #0.05 < p < 0.10, numbers within bar graphs are the mean, each symbol in the plots is the mean from each group at the given %P0, P0 = peak tetanic force, mN = millinewtons, gbm = grams body mass, fl/s = fiber lengths per second. Statistics: Student’s t test

