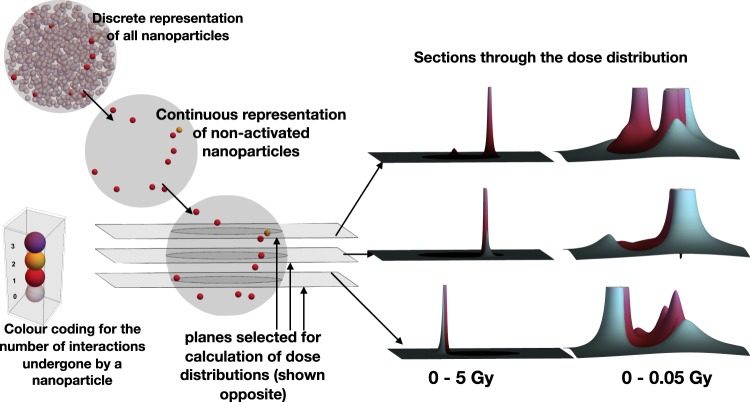
Figure 1.
Overview the simulation process, in this case, concerning a spherical, 500 nm radius cluster of 25 nm radius gold nanoparticles (10% volumetric fill factor), irradiated to 1 Gy (dose to surrounding water) with a 6 MeV clinical radiation beam. A nanoparticle cluster is generated stochastically, as is the number of interactions each nanoparticle has with the radiation. The few nanoparticles undergoing interactions remain discretely represented while the remainder are transformed into a continuous representation which preserves the average gold density distribution (see methods for details). To determine the dose distribution at any point, the dose distributions due to the activated nanoparticles are summed in a way which takes account of the attenuation due to the non-activated nanoparticles. This (slightly) unusual cluster was chosen for illustration purposes because it contains a nanoparticle undergoing two activation events. Only about 1/10th of such clusters would show this property. For the particular cluster illustrated above, the dose distribution through 3 planes passing through the cluster are illustrated. ‘Plum’ colours have been used to represent dose deposited within the cluster and ‘blues’ to represent dose deposited outside.

