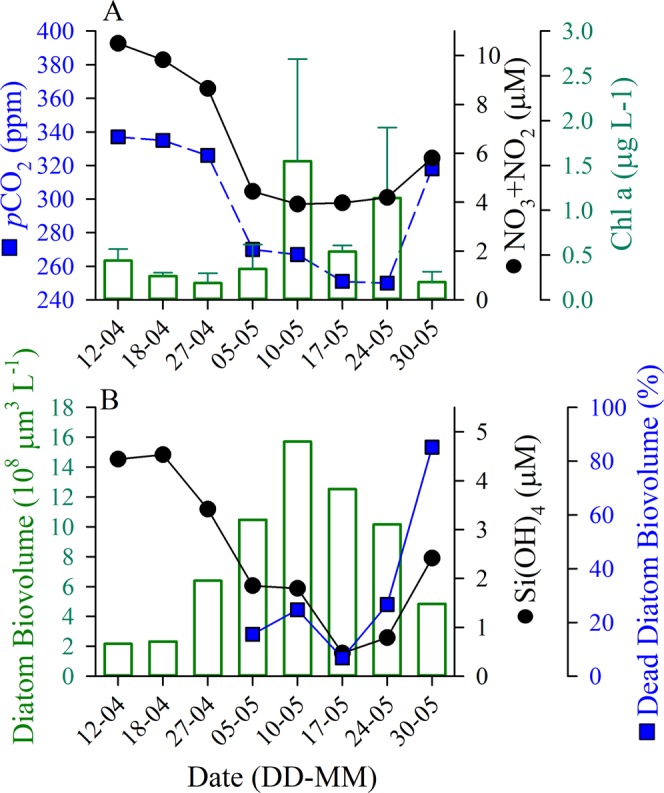
Figure 1.

(A) Temporal variation during spring 2017 of NO3 + NO2 (black symbols/line), partial pressure of CO2 (pCO2, blue symbols/line) and Chl a (green bars, ± Stdev.) at 5 m depth (station GF3, Godthåbsfjord, Greenland). (B) Change in diatom biomass (green bars), Si(OH)4 (blue symbols/line) through time at 5-m depth and the percentage of dead diatoms (as biovolume) from 10-m integrated sample through time; diatom viability samples started May 5.
