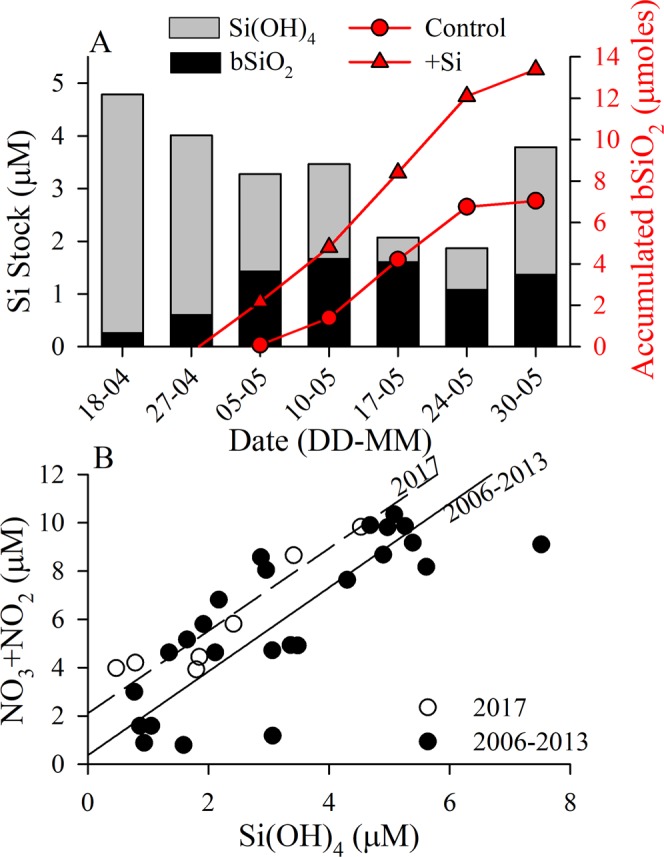
Figure 2.

(A) Inventory of total Si concentration (bars) distributed between particulate (bSiO2, black fill) and dissolved (Si(OH)4, grey fill) forms at 5-m depth (station GF3). Superimposed is the total accumulated stock of bSiO2, determined from two-day grow-out experimental rates, starting April 18. Rates are both in the control (red circles/line) and +Si (red triangles/line) bioassay treatments. Negative rates observed in late April indicated no net production of bSiO2 was quantifiable prior to the onset of the bloom. (B) NO3 + NO2 vs. Si(OH)4 for 5-m Niskin samples during 2017 and in previous years from the MarineBasis program at Nuuk (2006–2013). Linear regressions were done using a Model II reduced major axis method.
