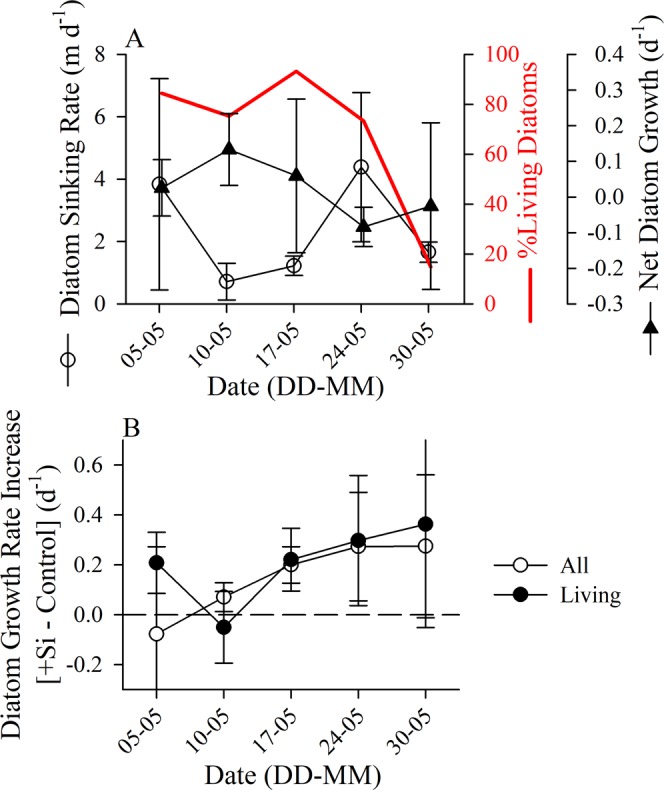
Figure 3.

(A) Temporal development of diatom net growth rate (filled triangles), sinking rate (open circles), and the percentage of living diatoms (red line) in the last five experiments during May 2017 for material collected in the upper photic zone (surface to 10 m). Error bars are standard deviation. (B) Difference in net growth rate for diatoms in the +Si bioassay treatment minus the growth rate in the control, symbols are for living and dead diatoms determined by direct counts of unpreserved material (open circles, denoted as “All”) or living diatoms determined by CDA method (closed circles). Error bars are the 95% confidence interval calculated using a student’s t distribution, which in all cases has a more liberal confidence interval than assuming a normal distribution (i.e. 95% confidence interval range smaller). The zero-difference line is denoted for reference.
