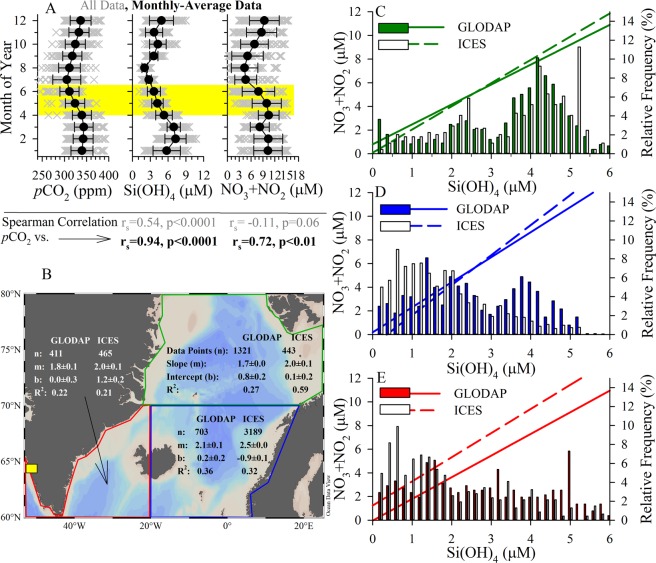
Figure 4.
Trends in the broader AASP. (A) Gridded pCO2 (left panel), Si(OH)4 (middle panel), and NO3 + NO2 (right panel) using data from41. Grey “X” values are raw data, black filled circles are monthly means (±Stdev.). Below plots are 2-tail Spearman Rho correlation statistics shown for comparison of pCO2 with each nutrient (statistics below each panel); gravy text is for raw data, black/bold text is for monthly-averaged data. The yellow highlighted area denotes the period of the year examined in all other panels (B–E) with independent data sets. (B) Map denoting zonation, database (GLODAP, ICES) metadata and Model II regression statistics (data points “n”, slope “m”, intercept “b”, R2) for regressions in panels C–E; MarineBasis station included for reference (yellow square). (C–E) Regressions for NO3 + NO2 vs. Si(OH)4 for the GLODAP (solid line) and ICES (dashed line) data and a histogram of [Si(OH)4] (relative frequency on right y-axis) for the GLODAP (filled bars) and ICES (open bars) data sets in the (C) Greenland and Norwegian Seas (Green), (D) north-eastern Atlantic (Blue), and (E) south-eastern coastal Greenland (Red). Regions were broadly separated by latitude (i.e. 60°–70°N, 70°–80° N), and the lower region separated loosely to reflect the different Longhurst provinces (i.e. combined AASP) associated with waters east and west of Iceland. Individual points colour coded for year of observation, among all domains in both data sets, are shown elsewhere (Fig. S3). For both data sets (C–E), sample data was confined to the map domain, within the upper 50 m of the water column, and only from April through mid-June.

