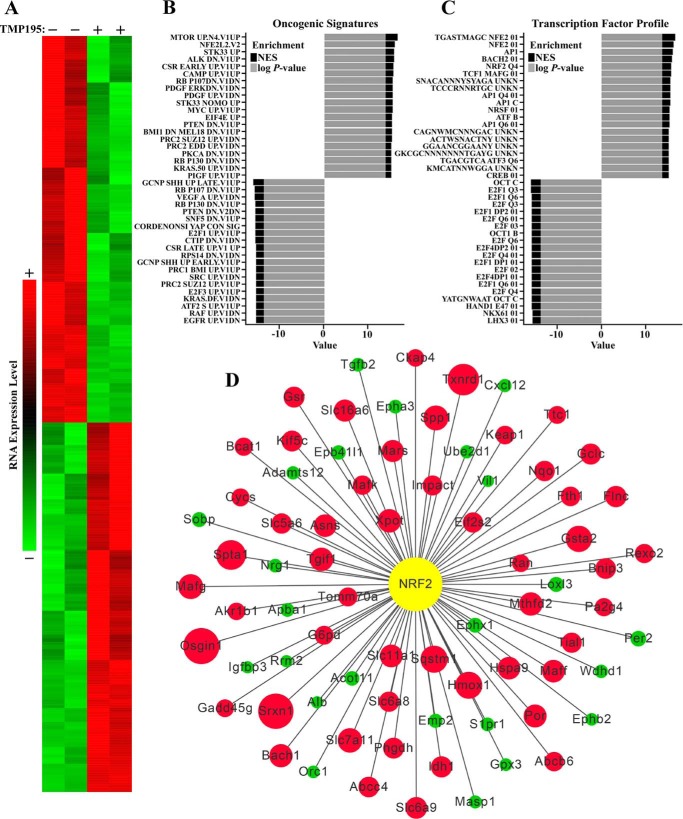
Figure 2.
Class IIa HDAC catalytic domain inhibition alters gene expression in cardiomyocytes. A, NRVMs were treated with vehicle control (DMSO, 0.1% final concentration) or TMP195 (3 μm) for 48 h. Shown is a heatmap representing significantly up-regulated or down-regulated transcripts determined by RNA-Seq analysis. B, pathway enrichments were computed using GSEA and databases available through the Molecular Signatures Database. The top 20 increased and decreased pathways in the Oncogenic Signature Database are displayed as a waterfall plot; UNKN, unknown. C, conserved cis-regulatory elements for genes enriched (positive log p value and NES) or decreased (negative log p value and NES) in TMP195-treated NRVMs. D, a network interaction model highlights the impact of TMP195 treatment on NRF2 target gene expression in NRVMs. The color of the node indicates the direction of the expression change with TMP195 treatment (green, down-regulation; red, up-regulation). The magnitude of change is indicated by the size of the node.

