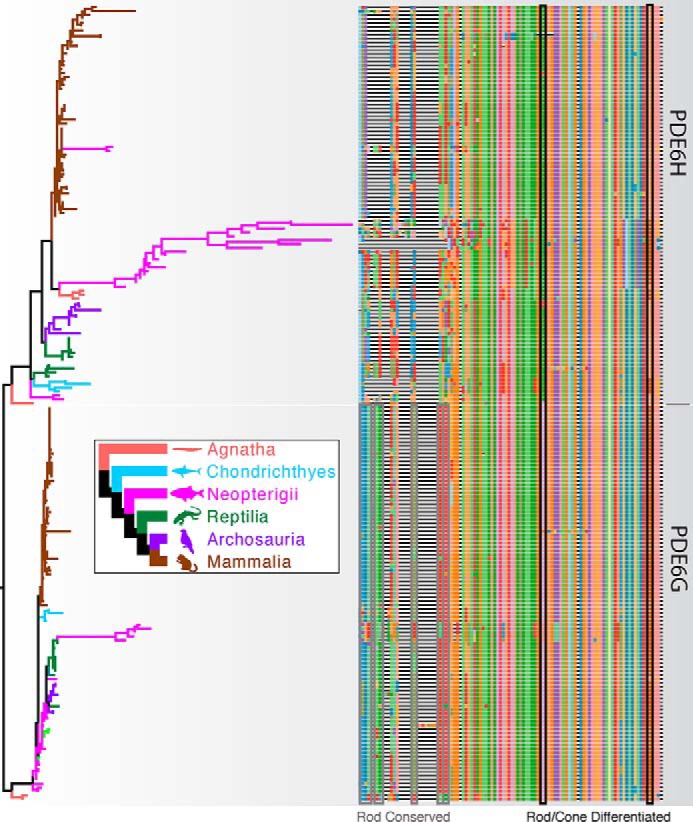
Figure 1.

Phylogenetic analysis of PDE6G (rod) and PDE6H (cone) sequences. Branch colors on the gene tree (left) correspond to the species tree (inset). The tree is rooted between putative rod and cone Pγ subunits. Multiple sequence alignment is plotted on the right. In the N-terminal region, several residues (Rod Conserved, gray boxes) are more than 90% conserved in the PDE6G alignment but divergent or missing in the PDE6H alignment. Two Rod/Cone Differentiated sequences (black boxes) are more than 80% conserved in either PDE6G and PDE6H alignments but differentiated between the two genes.
