Figure 1.
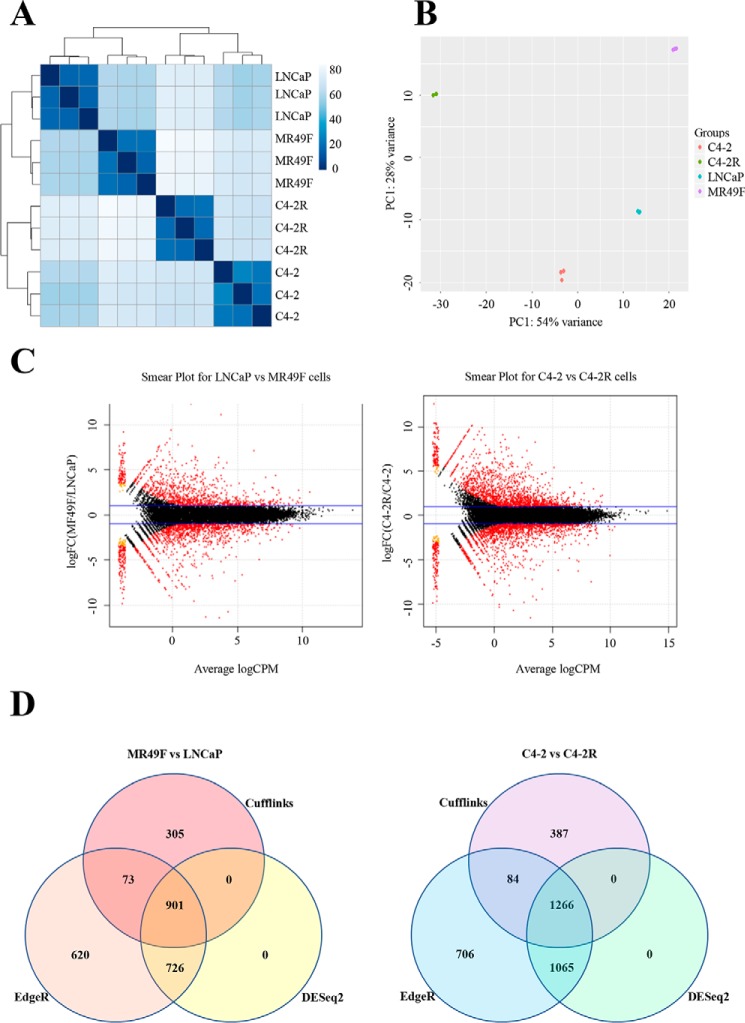
Long-term enzalutamide treatment of prostate cancer cell lines induces global gene expression changes after acquiring resistance. A, heat map showing the Euclidian distances between samples, made with the DESeq2 transformed data after a regularized log transformation was performed. B, PCA plot of libraries. Salmon-colored points represent C4-2 samples, green points represent C4-2R samples, teal points represent LNCaP samples, and purple points represent MR49F samples. Overall 54% of the variance is captured by the first principle component (shown on the x axis), and the second principle component (shown on the y axis) accounts for 28% of the variation. The data were normalized in DESeq2, and a regularized log transformation as performed prior to doing the PCA. C, smear plots from edgeR showing, in red, transcripts differentially expressed (false discovery rate < 0.01) between, respectively, enzalutamide-resistant/enzalutamide-sensitive cells. Blue lines indicate 2-fold-change cutoff. The x axis shows the average log (count per million, CPM), and the y axis shows the log2 (fold change). D, Venn diagrams of overlap between differential expression results among the three statistical packages Cufflinks, edgeR, and DESeq2 for both comparisons.

