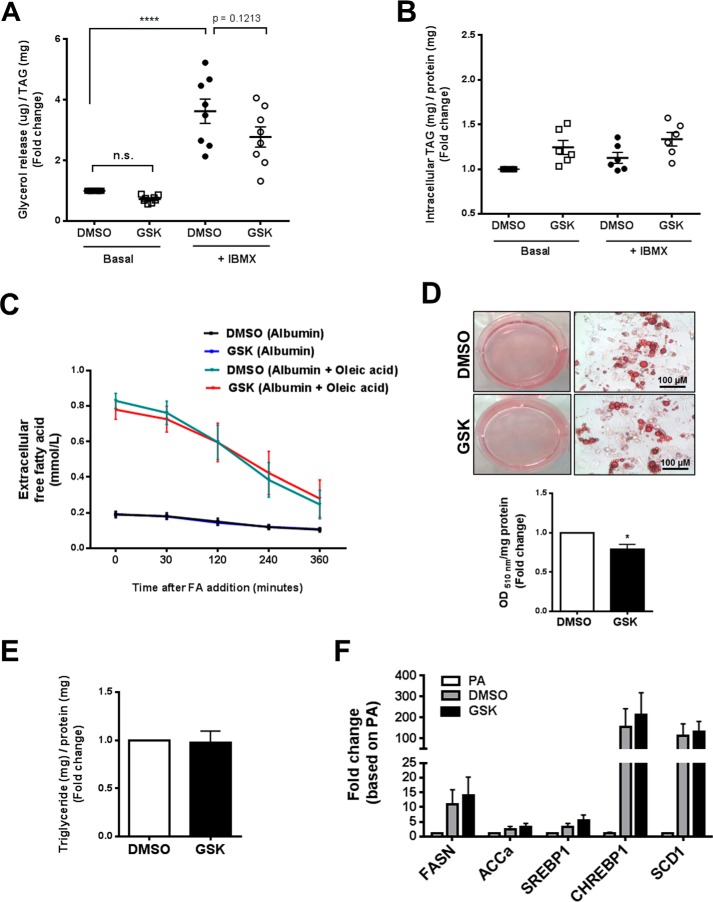
Figure 5.
Effects of EZH2 repression on in vitro lipolysis, FA uptake, and glucose-stimulated triglyceride accumulation in primary human adipocytes. A and B, lipolytic characterization of human adipocytes treated with either GSK126 or vehicle control. Free glycerol release (A, index of lipolysis, n = 8) and intracellular triglyceride (B) under basal and 200 μm IBMX-stimulated states (n = 6). Data were normalized to cell triglyceride levels in unstimulated cells. C, time course of extracellular FA (oleic acid) uptake in human adipocytes treated with either GSK126 or vehicle. D, representative appearance of cytoplasmic lipid droplets (ORO staining) in human adipocytes treated with either GSK126 or vehicle control and maintained in high-glucose (5 mm)/serum-free medium (n = 4). Neutral lipid accumulation was quantified by spectrophotometry (510 nm). E, intracellular triglyceride content. F, mRNA expression of key DNL markers was determined by qPCR. ****, p < 0.0001; n.s., not significant; TAG, triglyceride; FASN, fatty acid synthase; ACCa, acetyl-CoA carboxylase α; SREBP1, sterol regulatory element–binding protein 1; CHREBP1, carbohydrate-responsive element-binding protein (also known as MLX-interacting protein-like (MLXIPL)); SCD1, stearoyl-CoA desaturase 1. Error bars, S.E.

