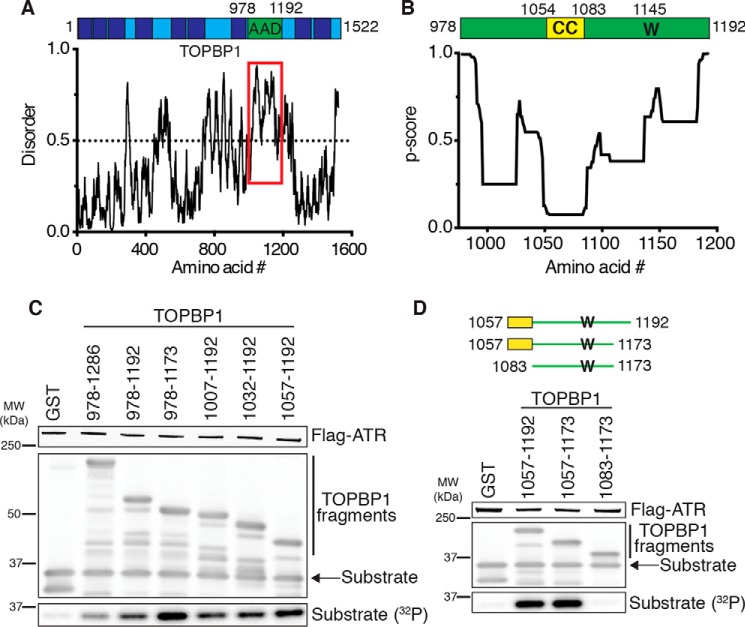
Figure 2.
Identification of the TOPBP1 ATR activation domain. A, schematic of TOPBP1 with the AAD indicated. BRCT domains are shown as dark blue boxes. TOPBP1 predicted disorder was calculated using IUPred2A (31). The AAD region is indicated by the red box. B, schematic of the TOPBP1 AAD, with the critical tryptophan (W) and predicted coiled coil (CC) indicated. Predicted coiled coil per residue scores were calculated using Paircoil2 (29). C and D, purified ATR–ATRIP complexes were incubated with GST or the indicated GST-TOPBP1 AADs, an ATR substrate, and [γ-32P]ATP. Reaction products were separated by SDS-PAGE and detected by Coomassie staining and immunoblotting. Substrate phosphorylation was detected by autoradiography. MW, molecular weight.

