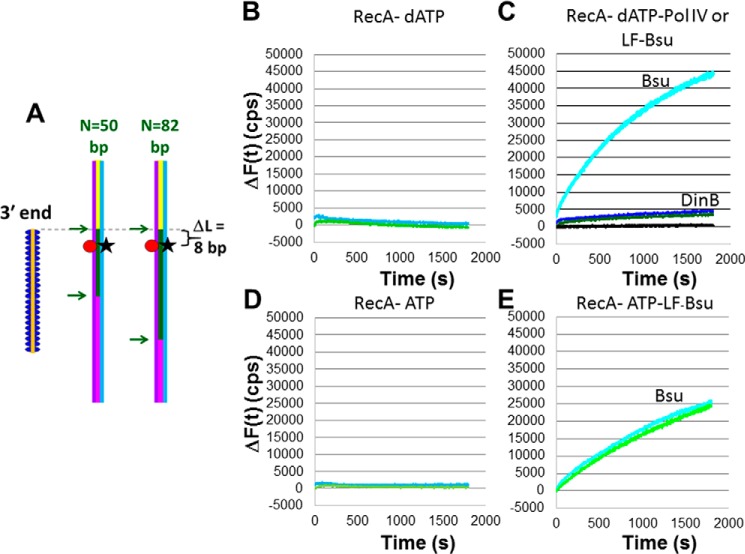
Figure 2.
Measurements of RecA-mediated heteroduplex product formation in the presence or absence of DNA synthesis. A, schematic of the experimental setup with the initiating ssDNA shown in orange. The purple and blue lines indicate the complementary and outgoing strands in the dsDNA, respectively. The green regions in the dsDNA are sequence-matched to the corresponding regions in the 98-nt filament. The yellow regions in the 180-bp dsDNA extend beyond the 3′ end of the initiating strand, and the magenta regions are heterologous to the corresponding regions in the initiating strand. The red circles represent the rhodamine labels. The black stars represent fluorescein labels that are quenched when the complementary and outgoing strands are paired. The fluorophores are 58 (rhodamine) and 57 bp (fluorescein) from the end of the dsDNA. The 3′ end of the ssDNA–RecA filaments is 50 bp from the end of the dsDNA, yielding ΔL = 8. B, ΔF(t) versus time curves in the presence of RecA only and dATP for N = 82 (light blue) and N = 50 (light green). C, same as B but DNA Pol IV is also present for N = 82 (dark blue) and N = 50 (dark green), or LF-Bsu Pol is also present for N = 82 (cyan) and N = 0 (black). The estimated yield of ssDNA outgoing strand formation for LF-Bsu Pol and for DNA Pol IV is 80 and 6%, respectively. D, ΔF(t) versus time curves in the presence of RecA only and ATP for N = 82 (light blue) and N = 50 (light green). E, same as D but DNA LF-Bsu Pol is also present for N = 82 (cyan) and N = 50 (bright green). The estimated yield of ssDNA outgoing strand formation in the presence of LF-Bsu Pol is 45%. Results shown are for a single data set.

