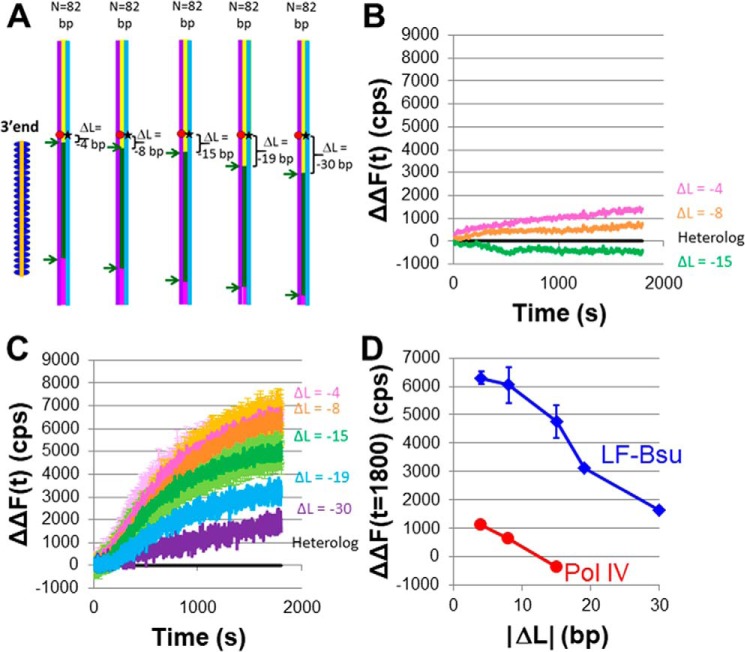
Figure 3.
Measurements of invading strand extension in a D-loop formed by RecA-mediated heteroduplex product formation when N = 82. A, schematic of the experimental design using the same symbols as in Fig. 2A. The dsDNA is 180 bp long, and the fluorophores are 58 (rhodamine) and 57 bp (fluorescein) from the end of the dsDNA; the 3′ end of the ssDNA–RecA filaments is 62, 66, 73, 77, or 88 bp from the end of the dsDNA, yielding ΔL values of −4, −8, −15, −19, and −30, respectively. B, ΔΔF(t) versus time curves averaged over 20 s for strand exchange in the presence of DNA Pol IV for ΔL = −4 (magenta), ΔL = −8 (orange), and ΔL = −15 (green). The second Δ indicates that the ΔF(t) curves for the heterologous ssDNA–RecA filament (i.e. N = 0) were subtracted from the ΔF(t) curves for N > 0. The yield of outgoing strand formation is 2.5 and 1.5% for ΔL = −4 and ΔL = −8, respectively. C, analogous results in the presence of DNA LF-Bsu Pol for ΔL = −4 (magenta), ΔL = −8 (orange), ΔL = −15 (green), ΔL = −19 (blue), and ΔL = −30 (purple). The dark lines correspond to averages over several data sets, and the corresponding error bars are shown in lighter colors. The yield of outgoing strand formation is between 12.3 (ΔL = −4) and 3.3% (ΔL = −30). D, ΔΔF(t = 1800) versus ΔL curves corresponding to B (red) and Fig. 3C (blue). Error bars represent S.D. for multiple independent data sets.

