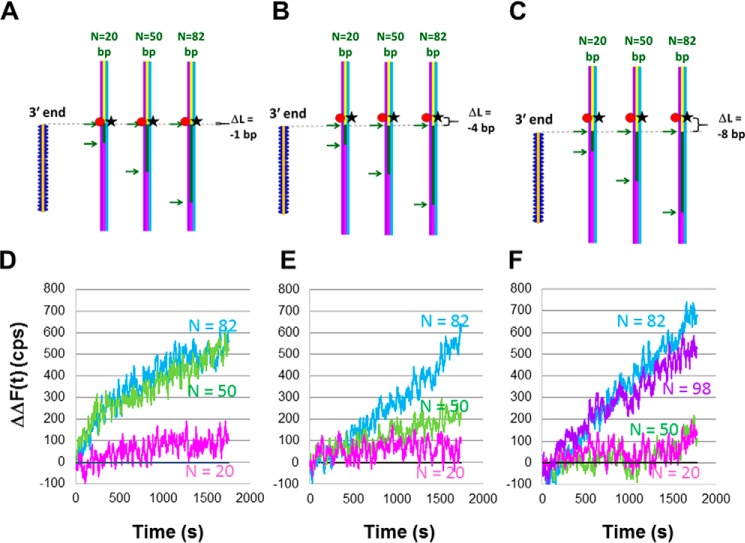
Figure 4.
Measurements of the N dependence of invading strand extension in a D-loop resulting from RecA-mediated heteroduplex product formation when DNA synthesis is performed by DNA Pol IV. A, schematic of the experimental design using the same symbols as in Fig. 2A. The dsDNA is 180 bp long, and the fluorophores are 58 (rhodamine) and 57 bp (fluorescein) from the end of the dsDNA. The 3′ end of the ssDNA–RecA filaments is 59 bp from the end of the dsDNA, yielding ΔL = −1. B, same as A but the 3′ end of the invading strands is 62 bp from the end of the dsDNA, yielding ΔL = −4. C, same as A but the 3′ end of the invading strands is 66 bp from the end of the dsDNA, yielding ΔL = −8. D, ΔΔF(t) versus time curves averaged over 20 s for N = 82 (blue), N = 50 (green), N = 20 (magenta), and N = 0 (black) for the experimental design shown in A. The second Δ indicates that the fluorescence signal of the heterologous ssDNA–RecA filament (N = 0) has been subtracted from each curve. The results are for a single data set. E, ΔΔF(t) versus time curves for N = 82 (blue), N = 50 (green), N = 20 (magenta), and N = 0 (black) for the experimental design shown in B. F, ΔΔF(t) versus time curves for N = 98 (purple), N = 82 (blue), N = 50 (green), N = 20 (magenta), and heterologous N = 0 (black) are shown for the experimental design shown in C. Analogous curves without the subtraction of the heterologous filament are shown in Fig. S6. Results are for a single data set. The yield of outgoing strand formation is about 1% for N = 82 in all three cases.

