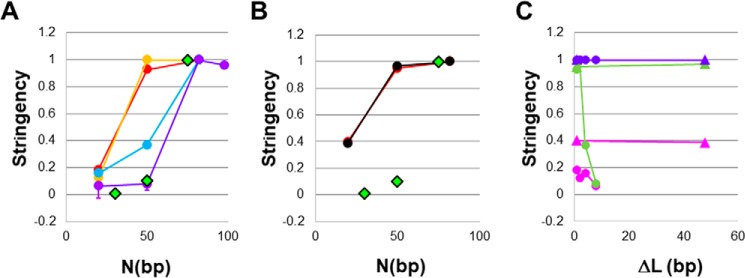
Figure 6.
N or |ΔL| dependence of the ΔΔF(1800) values shown in Figs. 4, S7, and 5, normalized to the result for N = 82 (ΔΔF(1800) ratio [N]). A, for DNA Pol IV, stringency = ΔΔF(1800) ratio [N] as a function of N for fluorescent labels with different separations from the 3′ end of the original initiation ssDNA. The red, orange, blue, and purple curves show results for labels at ΔL = −1, −2, −4, and −8 bp, respectively. The green diamonds show the stringency for in vivo studies (11). B, same as A but for DNA LF-Bsu Pol, showing results for ΔL = −1 (red) and ΔL = −48 (black). C, the data are the same as the data shown in A and B, but the ΔΔF(1800) ratio [N] values for particular N are plotted as a function of |ΔL|. The circles and triangles represent the results for DNA Pol IV and DNA LF-Bsu Pol, respectively. The colors of the curves correspond to the N values. The magenta, green, and blue lines represent N = 20, 50, and 82, respectively. For DNA LF-Bsu Pol the ΔΔF(1800) ratio [N] values are insensitive to |ΔL|, but for DNA Pol IV the results depend strongly on |ΔL|. Error bars represent S.D. values.

